
USAS
Americas Gold and Silver Corporation
- Overview
- Forecast
- Valuation
- Earnings

Line
|

Candle
1D
5D
1M
3M
6M
YTD
1Y
5Y
High
0.970
Open
0.9547
VWAP
0.95
Vol
1.33M
Mkt Cap
57.16M
Low
0.935
Amount
1.27M
EV/EBITDA(TTM)
--
Total Shares
251.02M
EV
650.63M
EV/OCF(TTM)
--
P/S(TTM)
4.61
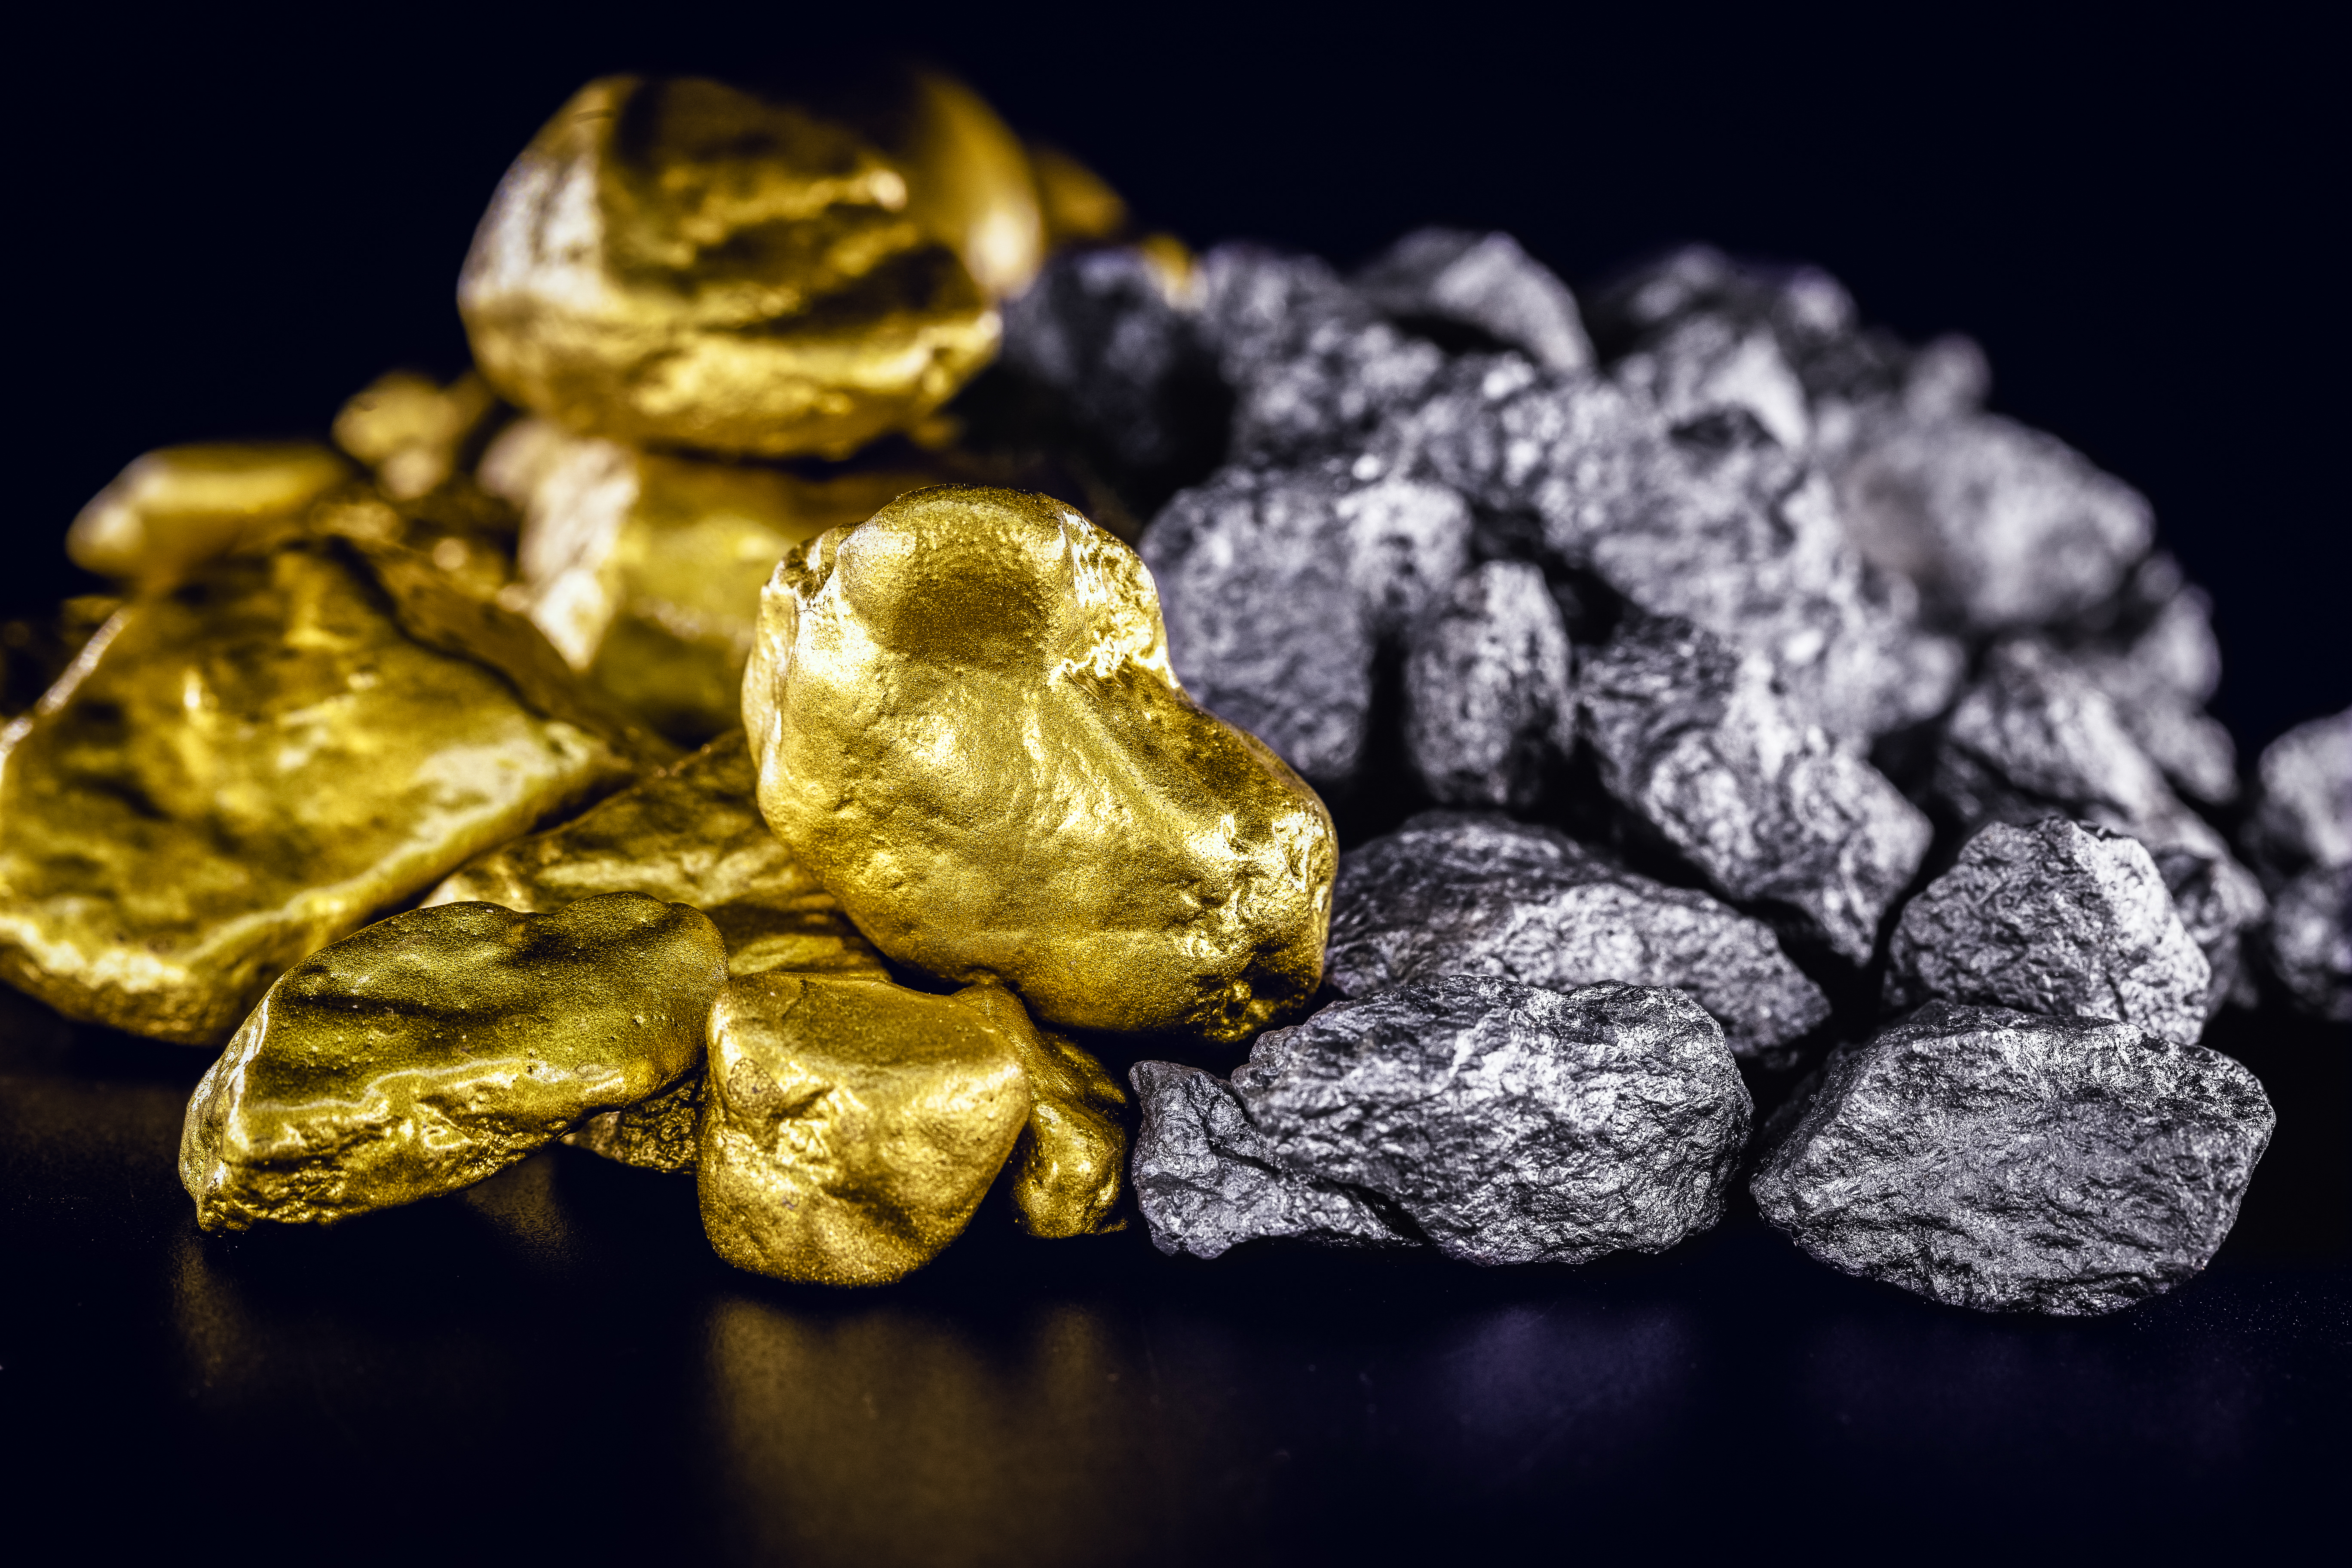
Americas Gold and Silver Corporation is a Canada-based precious metals mining company with multiple assets in North America. The Company owns and operates the Galena Complex in Idaho, United States of America (USA); the Cosala Operations in Sinaloa, Mexico, and the Relief Canyon mine, which is under care and maintenance in Nevada, USA. It also owns the San Felipe development project in Sonora, Mexico. The 100%-owned Cosala Operations are located in the state of Sinaloa, Mexico and consist of about 67 mining concessions that cover approximately 19,385 hectares (ha). The 100% owned Galena Complex is located in Idaho’s Silver Valley. The Relief Canyon Mine is located in Pershing County, Nevada. The project encompasses an open pit mine and heap leach processing facility. The Company’s landholdings cover approximately 25,000 acres, which include the Relief Canyon Mine asset and lands surrounding the mine in all directions. San Felipe silver-zinc-lead project is located in Sonora, Mexico.
Show More
Market Estimates
Earnings Estimates
Revenue
YoY Chg
EPS
YoYChg
FY2024Q3
28.60M
+56.35%
--
--
Estimates Revision
The market is revising Downward the revenue expectations for Americas Gold and Silver Corporation (USAS) for FY2025, with the revenue forecasts being adjusted by -0.66% over the past three months. During the same period, the stock price has changed by 62.71%.
Revenue Estimates for FY2025
Revise Downward

-0.66%
In Past 3 Month
Stock Price
Go Up

+62.71%
In Past 3 Month
2 Analyst Rating
Wall Street analysts forecast USAS stock price to rise over the next 12 months. According to Wall Street analysts, the average 1-year price target for USAS is 1.19 USD with a low forecast of 1.09 USD and a high forecast of 1.30 USD. However, analyst price targets are subjective and often lag stock prices, so investors should focus on the objective reasons behind analyst rating changes, which better reflect the company's fundamentals.
1 Buy
1 Hold
0 Sell
Moderate Buy
Current: 0.960

Low
1.09
Averages
1.19
High
1.30
Current: 0.960

Low
1.09
Averages
1.19
High
1.30
H.C. Wainwright
Buy
maintain
$1
2025-07-10
Reason
H.C. Wainwright
Price Target
$1
2025-07-10
maintain
Buy
Reason
H.C. Wainwright raised the firm's price target on Americas Gold and Silver to $1.30 from $1 and keeps a Buy rating on the shares. The firm cites its increased price deck for the target bump.
HC Wainwright & Co.
Heiko Ihle
Strong Buy
Maintains
$0.9 → $1
2025-03-28
Reason
HC Wainwright & Co.
Heiko Ihle
Price Target
$0.9 → $1
2025-03-28
Maintains
Strong Buy
Reason
HC Wainwright & Co.
Heiko Ihle
Strong Buy
Maintains
$1 → $0.9
2025-03-18
Reason
HC Wainwright & Co.
Heiko Ihle
Price Target
$1 → $0.9
2025-03-18
Maintains
Strong Buy
Reason
HC Wainwright & Co.
Heiko Ihle
Strong Buy
Reiterates
$0.8
2024-10-10
Reason
HC Wainwright & Co.
Heiko Ihle
Price Target
$0.8
2024-10-10
Reiterates
Strong Buy
Reason
HC Wainwright & Co.
Heiko Ihle
Strong Buy
Maintains
$0.7 → $0.8
2024-08-20
Reason
HC Wainwright & Co.
Heiko Ihle
Price Target
$0.7 → $0.8
2024-08-20
Maintains
Strong Buy
Reason
See All Ratings
Valuation Metrics
The current forward P/E ratio for Americas Gold and Silver Corporation (USAS.A) is 62.67, compared to its 5-year average forward P/E of 299.38. For a more detailed relative valuation and DCF analysis to assess Americas Gold and Silver Corporation 's fair value, click here.
Forward PE
The forward P/E ratio is a valuation metric that divides a company's current stock price by its estimated future earnings per share over the next 12 months.

N/A
5Y Average PE
299.38
Current PE
62.67
Overvalued PE
2230.10
Undervalued PE
-1631.34
Forward EV/EBITDA
The forward EV/EBITDA ratio is a valuation metric that divides a company's enterprise value (EV) by its estimated future earnings before interest, taxes, depreciation, and amortization (EBITDA) over the next 12 months.

N/A
5Y Average EV/EBITDA
5.53
Current EV/EBITDA
18.96
Overvalued EV/EBITDA
23.42
Undervalued EV/EBITDA
-12.37
Forward PS
The forward P/S ratio is a valuation metric that divides a company's current stock price by its estimated future sales (or revenue) per share over the next 12 months.

Overvalued
5Y Average PS
1.69
Current PS
3.60
Overvalued PS
3.23
Undervalued PS
0.16
Financials
Annual
Quarterly
FY2025Q2
YoY :
-14.86%
26.93M
Total Revenue
FY2025Q2
YoY :
-1676.58%
-10.71M
Operating Profit
FY2025Q2
YoY :
+277.29%
-15.10M
Net Income after Tax
FY2025Q2
YoY :
-0.00%
-0.02
EPS - Diluted
FY2025Q2
YoY :
+106.83%
-5.03M
Free Cash Flow
FY2025Q2
YoY :
-180.06%
-11.32
Gross Profit Margin - %
FY2025Q2
YoY :
+180.32%
-34.62
FCF Margin - %
FY2025Q2
YoY :
+343.05%
-56.09
Net Margin - %
Trading Trends
Insider
Insiders are Neutral. There are no significant trading trends over the last month.
Sold
0-3
Months
0.0
USD
0
3-6
Months
0.0
USD
0
6-9
Months
0.0
USD
0
0-12
Months
0.0
USD
0
Bought
0-3
0
0.0
USD
Months
3-6
0
0.0
USD
Months
6-9
0
0.0
USD
Months
0-12
0
0.0
USD
Months
Hedge Fund
Hedge Funds are Neutral. There are no significant trading trends over the last quarter.
Sold
0-3
Months
0.0
Volume
0
3-6
Months
0.0
Volume
0
6-9
Months
0.0
Volume
0
0-12
Months
0.0
Volume
0
Bought
0-3
0
0.0
Volume
Months
3-6
0
0.0
Volume
Months
6-9
0
0.0
Volume
Months
0-12
0
0.0
Volume
Months
Congress Trading
Congress are Neutral. There are no significant trading trends over the last month.
Sold
0-3
Months
0.0
USD
0
3-6
Months
0.0
USD
0
6-9
Months
0.0
USD
0
0-12
Months
0.0
USD
0
Bought
0-3
0
0.0
USD
Months
3-6
0
0.0
USD
Months
6-9
0
0.0
USD
Months
0-12
0
0.0
USD
Months
Insider
Insiders are Neutral. There are no significant trading trends over the last month.
Sold
0-3
Months
0.0
USD
0
3-6
Months
0.0
USD
0
6-9
Months
0.0
USD
0
0-12
Months
0.0
USD
0
Bought
0-3
0
0.0
USD
Months
3-6
0
0.0
USD
Months
6-9
0
0.0
USD
Months
0-12
0
0.0
USD
Months
USAS News & Events
Events Timeline
2025-02-24 (ET)
2025-02-24
07:20:36
Americas Gold and Silver provides update on ongoing work at Galena

2024-12-19 (ET)
2024-12-19
16:32:32
Americas Gold and Silver closes acquisition of remaining interest in Galena

2024-12-18 (ET)
2024-12-18
05:33:44
New Found Gold appoints Americas Gold and Silver CEO Paul Huet as chairman

Sign Up For More Events
News
4.0
07-10BenzingaHC Wainwright & Co. Maintains Buy on Americas Gold And Silver, Raises Price Target to $1.3
4.5
06-27NASDAQ.COMFriday's ETF Movers: SVOL, SILJ
9.0
06-24NewsfilterAmericas Gold and Silver Corporation Announces Election of Directors and Annual Meeting Voting Results
Sign Up For More News
People Also Watch

WHLRL
Wheeler Real Estate Investment Trust Inc
132.110
USD
-11.10%

ATLCL
Atlanticus Holdings Corp
24.890
USD
+0.20%

ZTEK
Zentek Ltd
0.738
USD
-2.89%

ARMN
Aris Mining Corp
6.940
USD
+0.58%

ARBKL
Argo Blockchain PLC
1.750
USD
-7.89%

ZENA
ZenaTech Inc
4.940
USD
+0.20%

ABLLL
Abacus Life Inc
25.240
USD
+0.36%

ALC
Alcon AG
88.130
USD
+0.48%

WHFCL
WhiteHorse Finance Inc
25.500
USD
0.00%
FAQ

What is Americas Gold and Silver Corporation (USAS) stock price today?
The current price of USAS is 0.96 USD — it has increased 2.13 % in the last trading day.

What is Americas Gold and Silver Corporation (USAS)'s business?

What is the price predicton of USAS Stock?

What is Americas Gold and Silver Corporation (USAS)'s revenue for the last quarter?

What is Americas Gold and Silver Corporation (USAS)'s earnings per share (EPS) for the last quarter?

What changes have occurred in the market's expectations for Americas Gold and Silver Corporation (USAS)'s fundamentals?

How many employees does Americas Gold and Silver Corporation (USAS). have?
