URI Overview
-
$
0.000
0.000(0.000%)
At close0.000(0.000%)Aft-market
ET
Loading chart...


The current price of URI is 1076.81 USD — it has increased 2.65
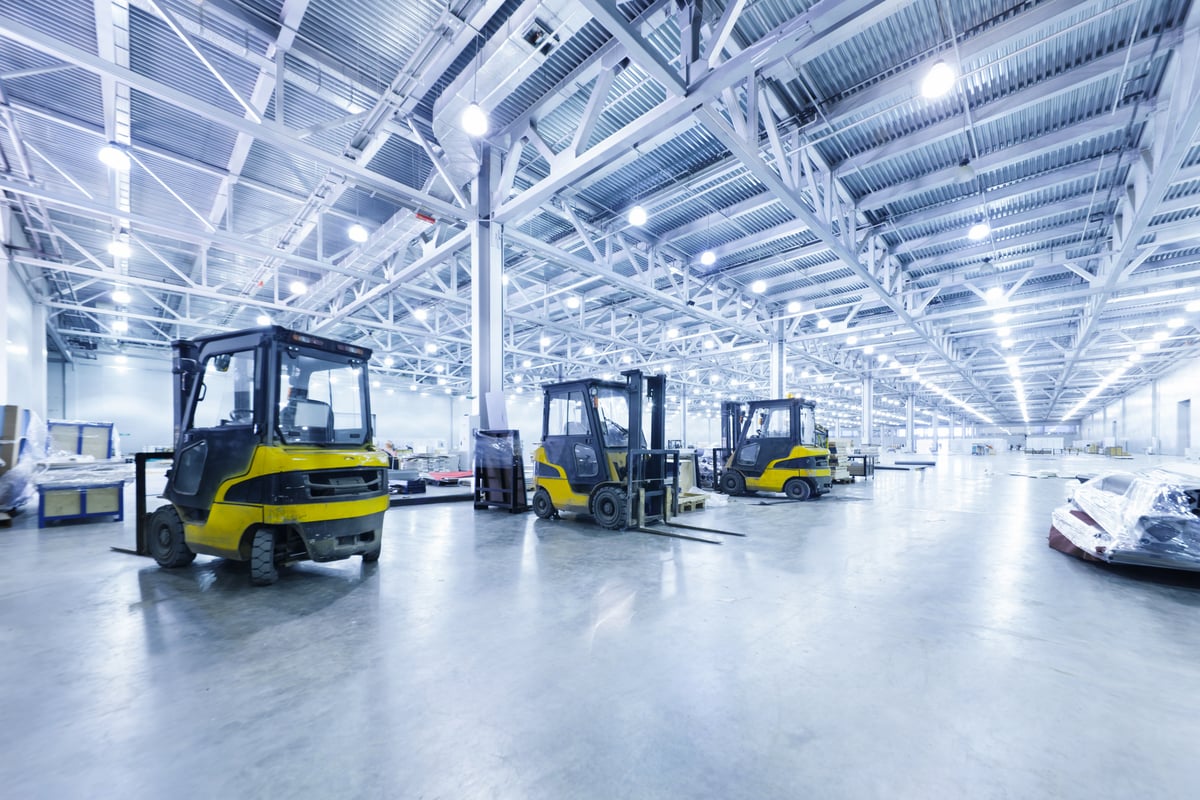
United Rentals, Inc. is an equipment rental company. The Company operates through two segments, which include General Rentals and Specialty. The General Rentals segment includes the rental of general construction and industrial equipment, such as backhoes, skid-steer loaders, forklifts, earthmoving equipment and material handling equipment; aerial work platforms, such as boom lifts and scissor lifts and general tools and light equipment, such as pressure washers, water pumps and power tools. The specialty segment rents products and provides setup and other services on such rented equipment, including trench safety equipment, such as trench shields, aluminum hydraulic shoring systems, slide rails, crossing plates, construction lasers and line testing equipment for underground work; power and heating, ventilation, and air conditioning (HVAC) equipment, such as portable diesel generators, electrical distribution equipment, and temperature control equipment.
Wall Street analysts forecast URI stock price to rise over the next 12 months. According to Wall Street analysts, the average 1-year price target for URI is1004 USD with a low forecast of 600.00 USD and a high forecast of 1150 USD. However, analyst price targets are subjective and often lag stock prices, so investors should focus on the objective reasons behind analyst rating changes, which better reflect the company's fundamentals.
United Rentals Inc revenue for the last quarter amounts to 3.98B USD, increased 7.15
United Rentals Inc. EPS for the last quarter amounts to 8.43 USD, increased 6.44
United Rentals Inc (URI) has 28500 emplpoyees as of June 20 2026.
Today URI has the market capitalization of 67.46B USD.