
Line
|

Candle
1D
5D
1M
3M
6M
YTD
1Y
5Y
High
2.740
Open
2.430
VWAP
2.44
Vol
8.71K
Mkt Cap
103.45M
Low
2.430
Amount
21.25K
EV/EBITDA(TTM)
12.05
Total Shares
41.55M
EV
93.46M
EV/OCF(TTM)
14.01
P/S(TTM)
0.83
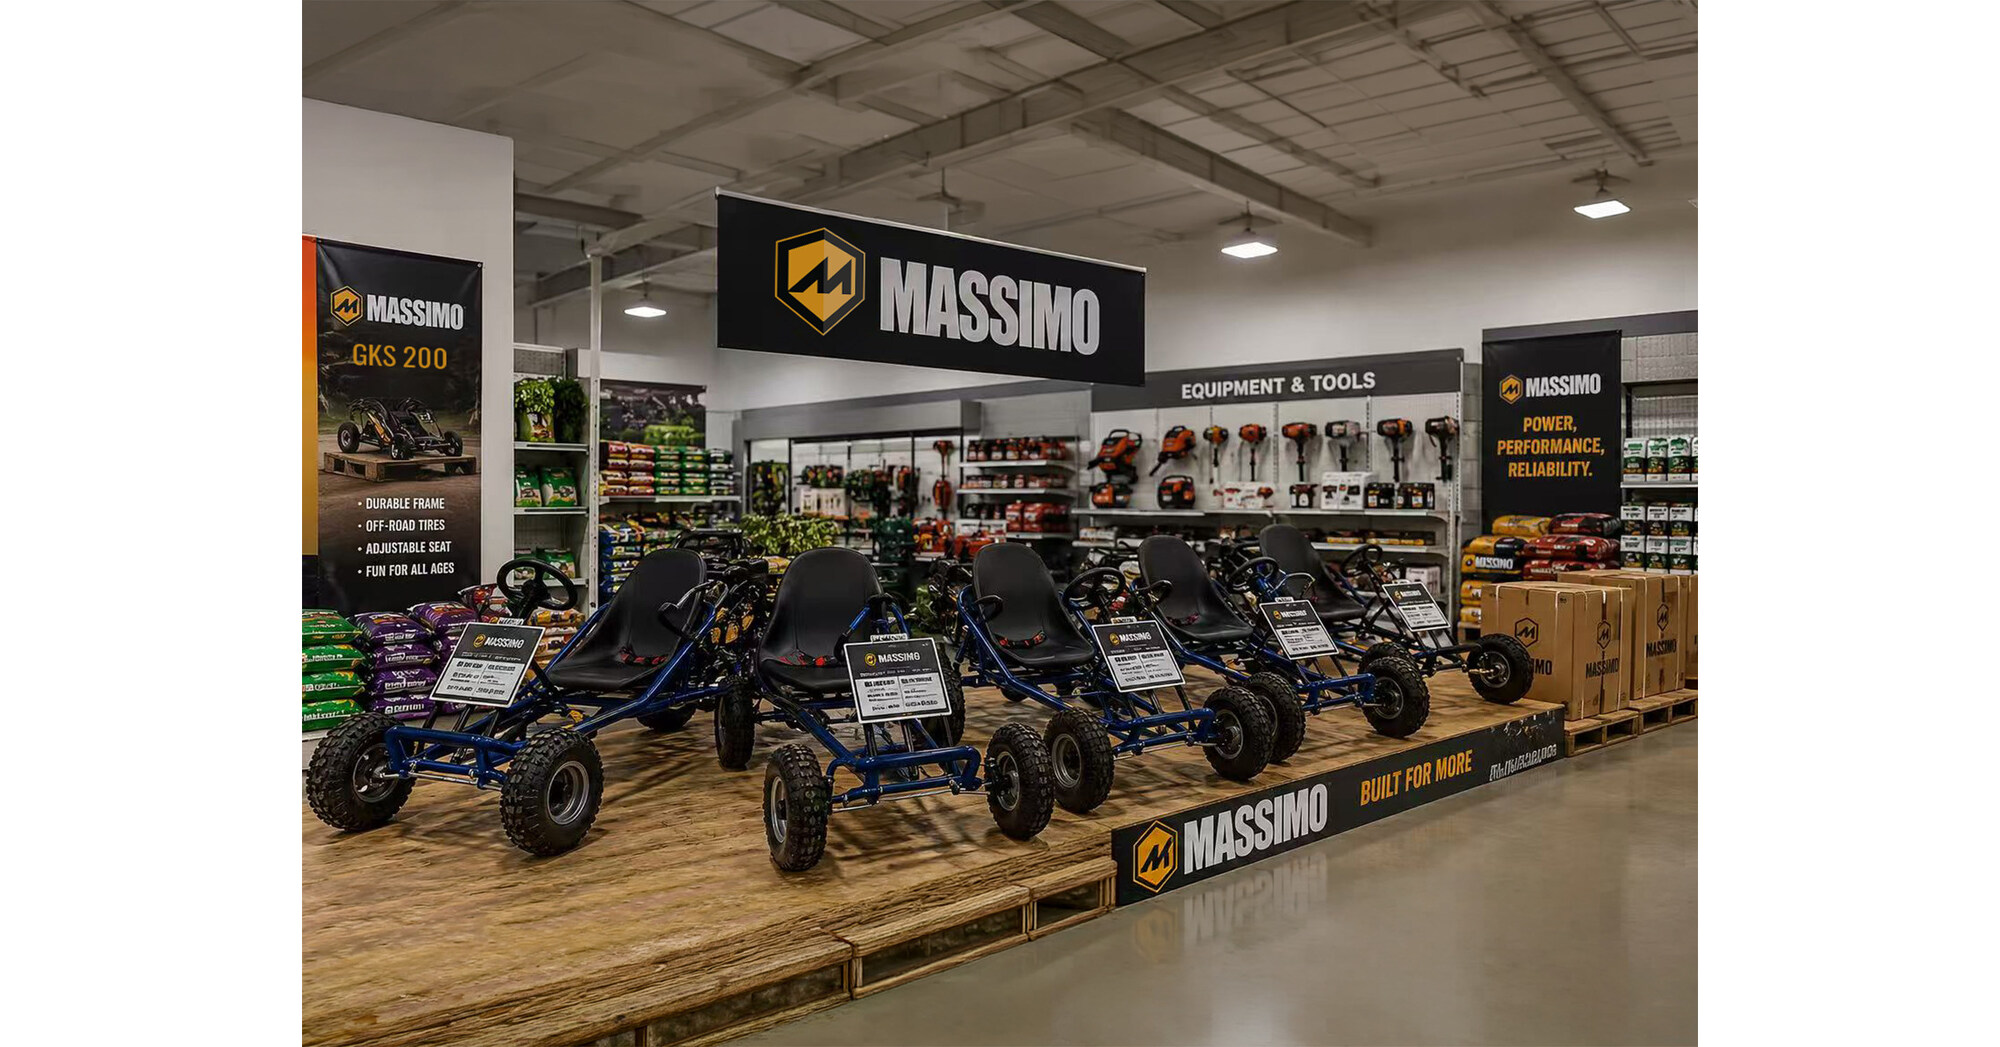
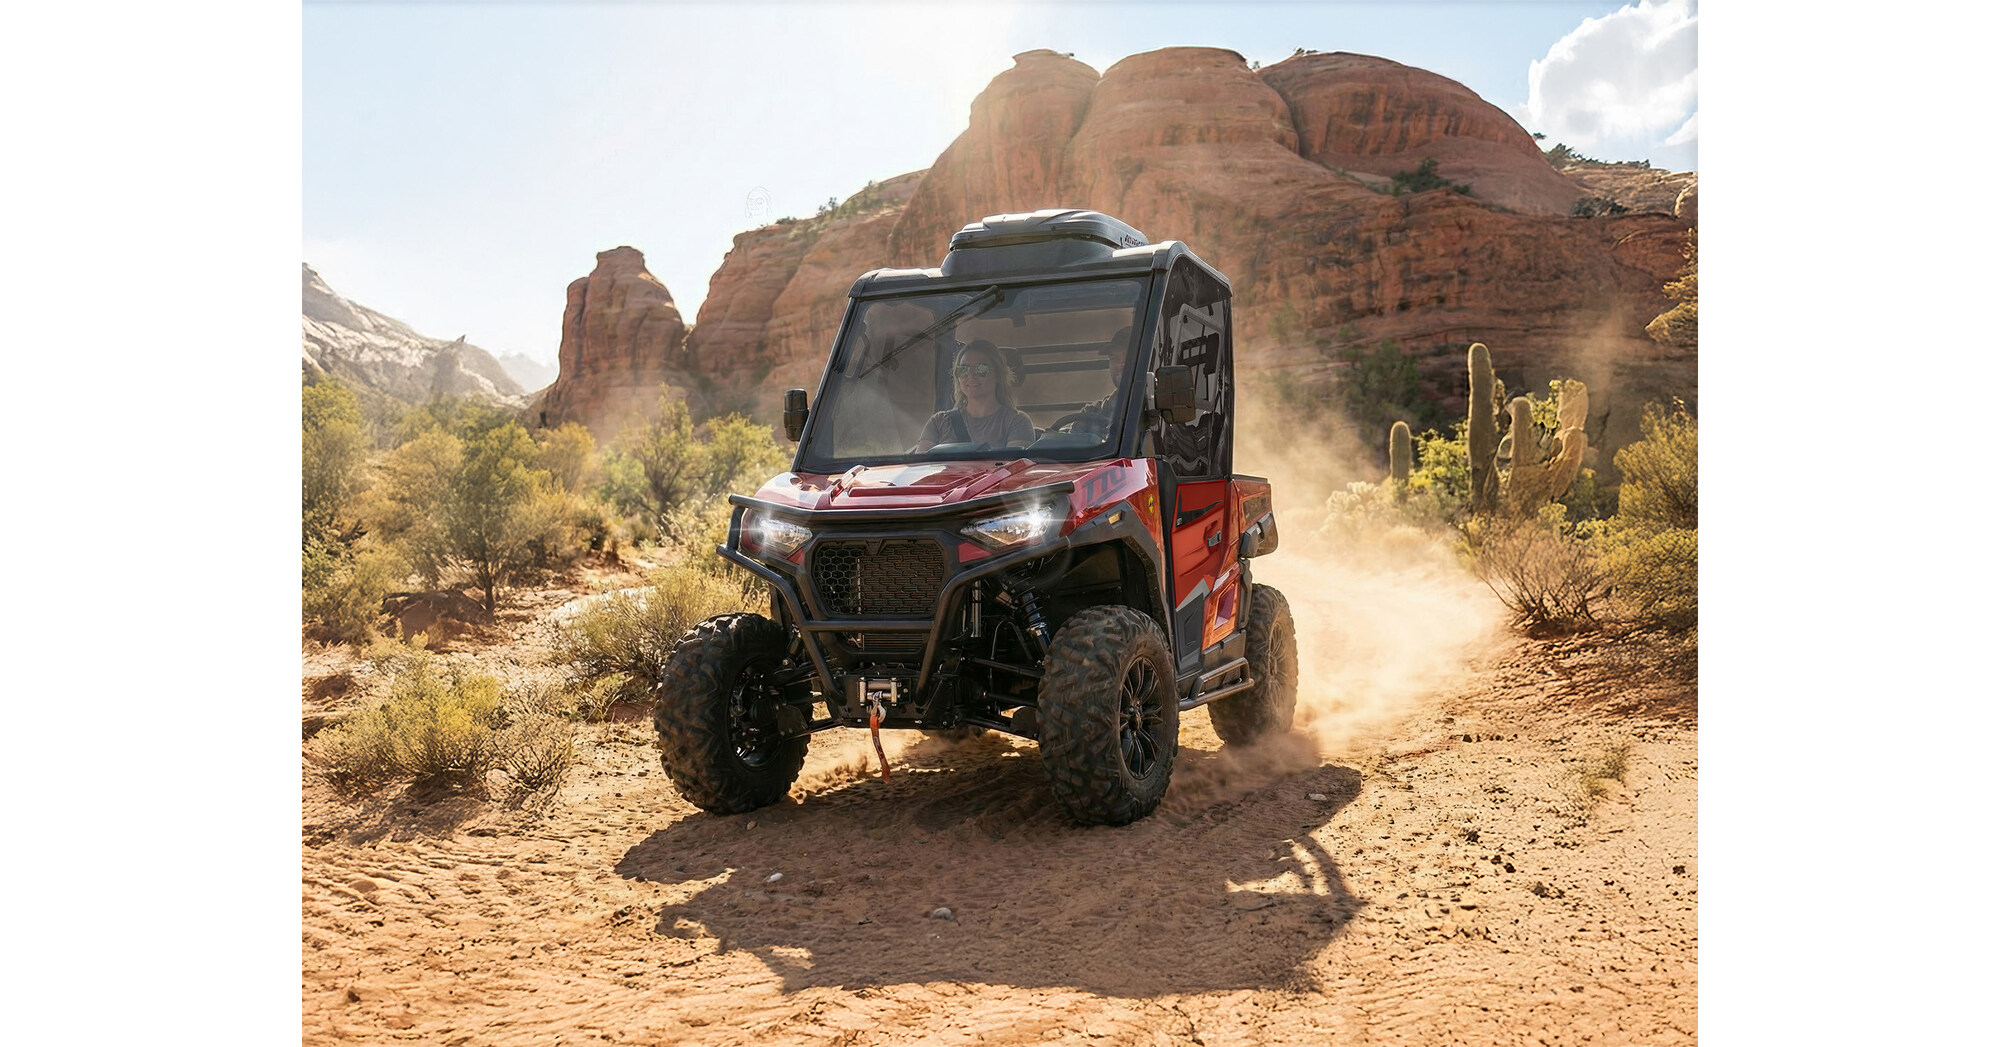
Massimo Group is a holding company. The Company manufactures, imports and distributes a diversified portfolio of products divided into two main lines: a motor sports brand consisting of utility terrain vehicles, all-terrain vehicles, motorcycles, scooters, golf carts and a juvenile line from go karts to balance bikes and a motorboat line consisting of pontoon and tritoon boats (Pontoon Boats). It is also focused on developing new product lines, such as electric vehicle chargers, portable solar panels, electric coolers, power stations and electric Pontoon Boats. In addition to distributing its products, it intends to provide unparalleled customer service through a network, including over 600 motor vehicles and 5,500 marine third-party service providers across the United States, 24-hour customer support and an over 40,000 square foot parts facility. Its products are sold directly by it, in the e-commerce marketplace, and through a network of dealerships, distributors and chain stores.
Show More
Valuation Metrics
The current forward P/E ratio for Massimo Group (MAMO.O) is 0.00, compared to its 5-year average forward P/E of 0.00. For a more detailed relative valuation and DCF analysis to assess Massimo Group 's fair value, click here.
Forward PE
The forward P/E ratio is a valuation metric that divides a company's current stock price by its estimated future earnings per share over the next 12 months.

N/A
5Y Average PE
0.00
Current PE
0.00
Overvalued PE
0.00
Undervalued PE
0.00
Forward EV/EBITDA
The forward EV/EBITDA ratio is a valuation metric that divides a company's enterprise value (EV) by its estimated future earnings before interest, taxes, depreciation, and amortization (EBITDA) over the next 12 months.

N/A
5Y Average EV/EBITDA
0.00
Current EV/EBITDA
0.00
Overvalued EV/EBITDA
0.00
Undervalued EV/EBITDA
0.00
Forward PS
The forward P/S ratio is a valuation metric that divides a company's current stock price by its estimated future sales (or revenue) per share over the next 12 months.

N/A
5Y Average PS
0.00
Current PS
0.00
Overvalued PS
0.00
Undervalued PS
0.00
Financials
Annual
Quarterly
FY2024Q4
YoY :
-49.30%
20.05M
Total Revenue
FY2024Q4
YoY :
-121.74%
-1.03M
Operating Profit
FY2024Q4
YoY :
-108.89%
-340.87K
Net Income after Tax
FY2024Q4
YoY :
-109.09%
-0.01
EPS - Diluted
FY2024Q4
YoY :
+78.94%
9.07M
Free Cash Flow
FY2024Q4
YoY :
-11.57%
27.13
Gross Profit Margin - %
FY2024Q4
YoY :
-39.70%
5.65
FCF Margin - %
FY2024Q4
YoY :
-117.53%
-1.70
Net Margin - %
FY2024Q4
12.53
ROIC
Trading Trends
Insider
Insiders are Neutral. There are no significant trading trends over the last month.
Sold
0-3
Months
0.0
USD
0
3-6
Months
0.0
USD
0
6-9
Months
0.0
USD
0
0-12
Months
0.0
USD
0
Bought
0-3
0
0.0
USD
Months
3-6
0
0.0
USD
Months
6-9
0
0.0
USD
Months
0-12
0
0.0
USD
Months
Hedge Fund
Hedge Funds are Neutral. There are no significant trading trends over the last quarter.
Sold
0-3
Months
0.0
Volume
0
3-6
Months
0.0
Volume
0
6-9
Months
0.0
Volume
0
0-12
Months
0.0
Volume
0
Bought
0-3
0
0.0
Volume
Months
3-6
0
0.0
Volume
Months
6-9
0
0.0
Volume
Months
0-12
0
0.0
Volume
Months
Congress Trading
Congress are Neutral. There are no significant trading trends over the last month.
Sold
0-3
Months
0.0
USD
0
3-6
Months
0.0
USD
0
6-9
Months
0.0
USD
0
0-12
Months
0.0
USD
0
Bought
0-3
0
0.0
USD
Months
3-6
0
0.0
USD
Months
6-9
0
0.0
USD
Months
0-12
0
0.0
USD
Months
Insider
Insiders are Neutral. There are no significant trading trends over the last month.
Sold
0-3
Months
0.0
USD
0
3-6
Months
0.0
USD
0
6-9
Months
0.0
USD
0
0-12
Months
0.0
USD
0
Bought
0-3
0
0.0
USD
Months
3-6
0
0.0
USD
Months
6-9
0
0.0
USD
Months
0-12
0
0.0
USD
Months
MAMO News & Events
Events Timeline
2025-02-11 (ET)
2025-02-11
07:36:21
Massimo moves MVR Golf Cart production to U.S.

2024-12-23 (ET)
2024-12-23
16:06:22
Massimo 'ramps-up' assembly line at Garland for T-Boss line of UTVs

2024-12-02 (ET)
2024-12-02
07:37:23
Massimo, Vision Marine announce production partnership

Sign Up For More Events
News
1.0
04-09NewsfilterMassimo Group CFO, Dr. Yunhao Chen, to Speak as Guest Panelist at the SEC's 44th Annual Small Business Forum
5.0
04-02NewsfilterMassimo Motor Launches New Online Sales Platform, Ushering in a New Era of Powersports Digital Retail
4.5
02-11NewsfilterMassimo Moves MVR Golf Cart Production to U.S. to Enhance Quality Control and Market Positioning
Sign Up For More News
People Also Watch

OPAL
Opal Fuels Inc
1.730
USD
-0.57%

WLDN
Willdan Group Inc
39.400
USD
+2.63%

NYMT
New York Mortgage Trust Inc
5.750
USD
+1.95%

CASS
Cass Information Systems Inc
41.070
USD
+1.23%

CMTG
Claros Mortgage Trust Inc
2.430
USD
0.00%

EBF
Ennis Inc
17.840
USD
-0.45%

CRNC
Cerence Inc
9.500
USD
-2.16%

LASR
nLIGHT Inc
7.810
USD
-0.13%

CLFD
Clearfield Inc
29.225
USD
+0.29%

HNRG
Hallador Energy Co
14.780
USD
+0.61%
FAQ

What is Massimo Group (MAMO) stock price today?
The current price of MAMO is 2.49 USD — it has increased 5.51 % in the last trading day.

What is Massimo Group (MAMO)'s business?

What is the price predicton of MAMO Stock?

What is Massimo Group (MAMO)'s revenue for the last quarter?

What is Massimo Group (MAMO)'s earnings per share (EPS) for the last quarter?

What changes have occurred in the market's expectations for Massimo Group (MAMO)'s fundamentals?

How many employees does Massimo Group (MAMO). have?
