LNG Overview
-
$
0.000
0.000(0.000%)
At close0.000(0.000%)Aft-market
ET
Loading chart...

The current price of LNG is 227.03 USD — it has decreased -1.89
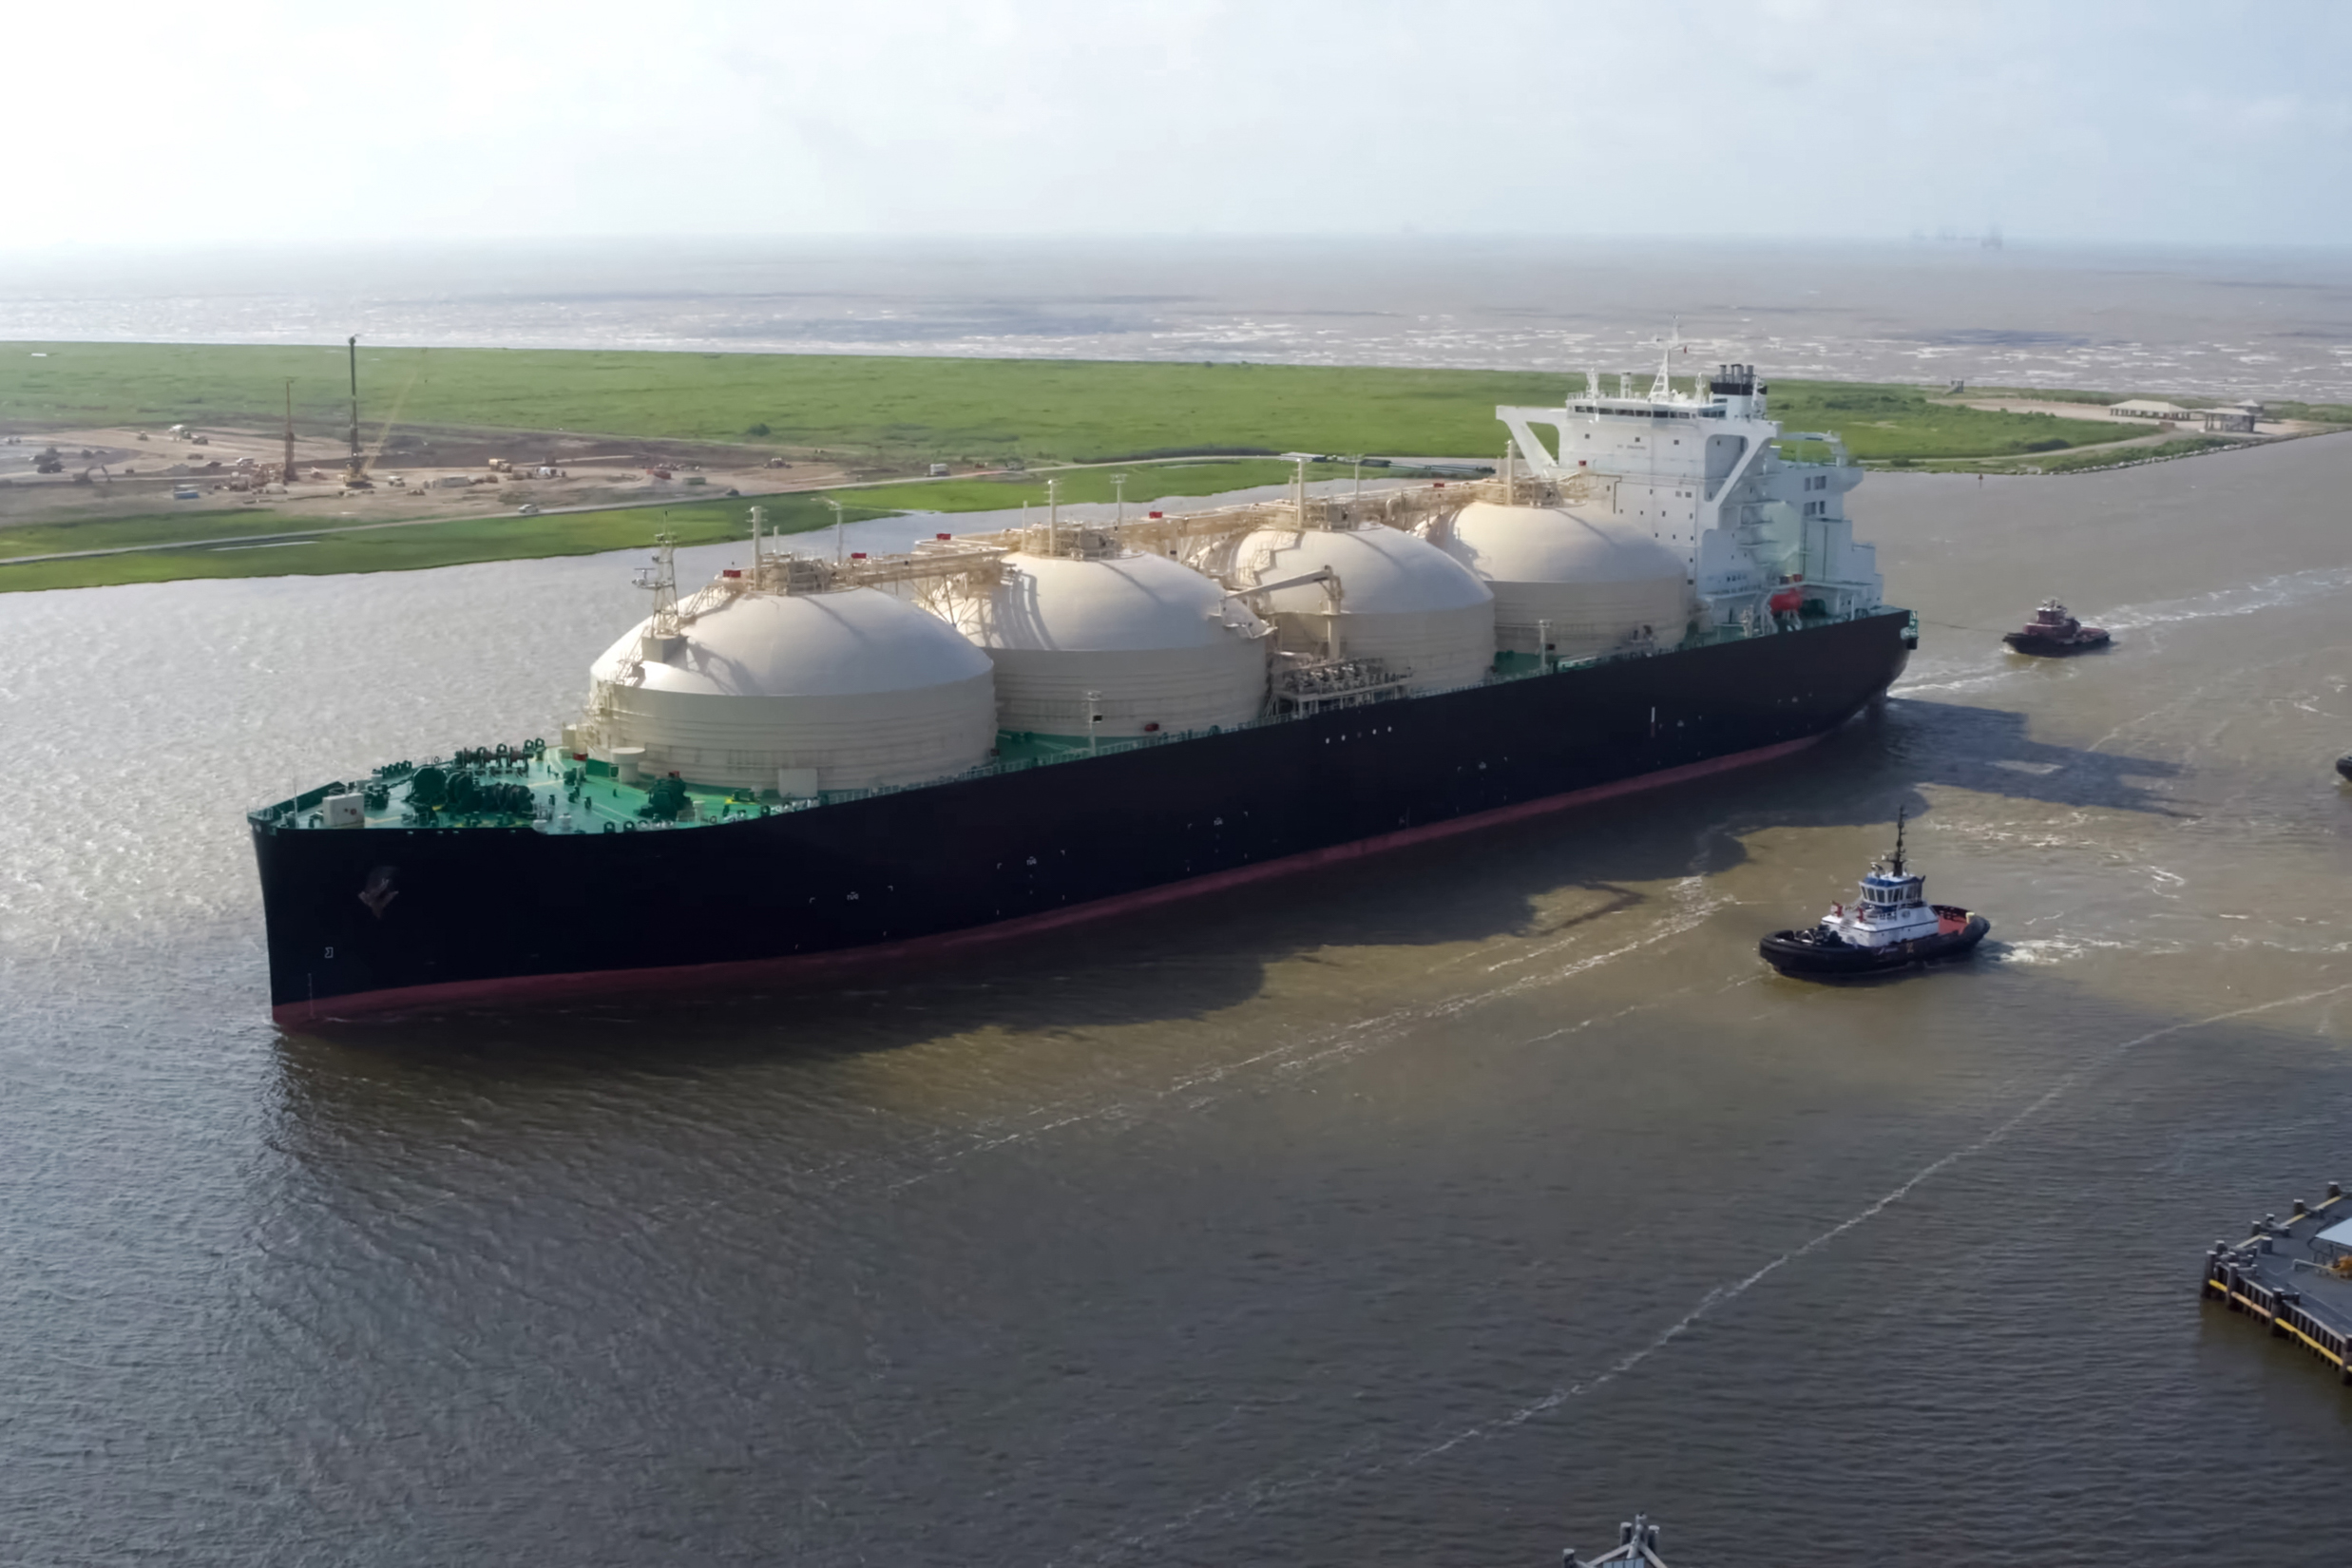
Cheniere Energy, Inc. is the producer and exporter of liquefied natural gas (LNG) in the United States. It provides clean, secure and affordable LNG to integrated energy companies, utilities and energy trading companies around the world. It operates two natural gas liquefaction and export facilities at Sabine Pass, Louisiana (Sabine Pass LNG Terminal) and near Corpus Christi, Texas (Corpus Christi LNG Terminal). It owns and operates over 30 million tons per annum (mtpa) of total production capacity in operation from natural gas liquefaction facilities located in Cameron Parish, Louisiana at Sabine Pass (the SPL Project). The Sabine Pass LNG Terminal also has five LNG storage tanks, vaporizers and three marine berths. The Corpus Christi LNG Terminal also has three LNG storage tanks and two marine berths. It also owns an approximately 21-mile natural gas supply pipeline that interconnects the Corpus Christi LNG Terminal with several large interstate and intrastate natural gas pipelines.
Wall Street analysts forecast LNG stock price to rise over the next 12 months. According to Wall Street analysts, the average 1-year price target for LNG is274.09 USD with a low forecast of 258.00 USD and a high forecast of 290.00 USD. However, analyst price targets are subjective and often lag stock prices, so investors should focus on the objective reasons behind analyst rating changes, which better reflect the company's fundamentals.
Cheniere Energy Inc revenue for the last quarter amounts to 5.87B USD, increased 7.79
Cheniere Energy Inc. EPS for the last quarter amounts to -16.65 USD, decreased -1153.80
Cheniere Energy Inc (LNG) has 1717 emplpoyees as of June 20 2026.
Today LNG has the market capitalization of 47.57B USD.