
IIPR
Innovative Industrial Properties Inc
- Overview
- Forecast
- Valuation
- Earnings

Line
|

Candle
1D
5D
1M
3M
6M
YTD
1Y
5Y
High
53.690
Open
53.440
VWAP
53.53
Vol
151.53K
Mkt Cap
1.50B
Low
52.850
Amount
8.11M
EV/EBITDA(TTM)
7.04
Total Shares
28.33M
EV
1.69B
EV/OCF(TTM)
7.02
P/S(TTM)
5.03
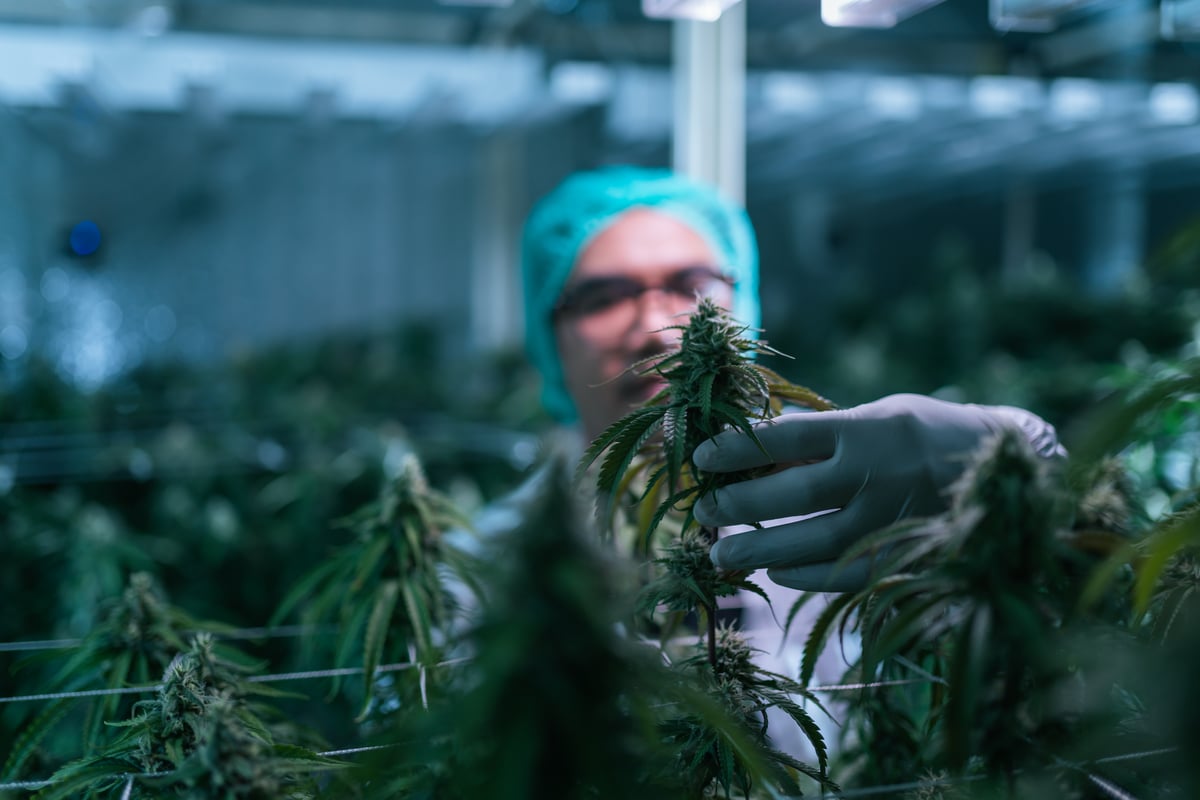
Innovative Industrial Properties, Inc. is an internally managed real estate investment trust (REIT). The Company is focused on the acquisition, ownership and management of specialized industrial properties leased to experienced, state-licensed operators for their regulated cannabis facilities. It acquires its properties through sale-leaseback transactions and third-party purchases. The Company owns approximately 109 properties comprising an aggregate of 9.0 million rentable square feet (including 666,000 rentable square feet under development/redevelopment) in 19 states, including Arizona, California, Colorado, Florida, Illinois, Maryland, Massachusetts, Michigan, Minnesota, Missouri, Nevada, New Jersey, New York, North Dakota, Ohio, Pennsylvania, Texas, Virginia, and Washington. Its subsidiary is IIP Operating Partnership, LP (Operating Partnership).
Show More
Market Estimates
Earnings Estimates
Revenue
YoY Chg
EPS
YoYChg
FY2025Q4
FY2025Q3
FY2025Q2
64.55M
-15.89%
--
--
63.97M
-16.4%
--
--
64.36M
-19.34%
--
--
Estimates Revision
The market is revising Downward the revenue expectations for Innovative Industrial Properties, Inc. (IIPR) for FY2025, with the revenue forecasts being adjusted by -2.29% over the past three months. During the same period, the stock price has changed by -0.17%.
Revenue Estimates for FY2025
Revise Downward

-2.29%
In Past 3 Month
Stock Price
Go Down

-0.17%
In Past 3 Month
3 Analyst Rating

-5.94% Downside
Wall Street analysts forecast IIPR stock price to fall over the next 12 months. According to Wall Street analysts, the average 1-year price target for IIPR is 50.50 USD with a low forecast of 45.00 USD and a high forecast of 56.00 USD. However, analyst price targets are subjective and often lag stock prices, so investors should focus on the objective reasons behind analyst rating changes, which better reflect the company's fundamentals.
0 Buy
2 Hold
1 Sell
Moderate Sell

-5.94% Downside
Current: 53.690

Low
45.00
Averages
50.50
High
56.00

-5.94% Downside
Current: 53.690

Low
45.00
Averages
50.50
High
56.00
Wolfe Research
Andrew Rosivach
Outperform
to
Peer Perform
downgrade
2025-07-02
Reason
Wolfe Research
Andrew Rosivach
Price Target
2025-07-02
downgrade
Outperform
to
Peer Perform
Reason
Wolfe Research analyst Andrew Rosivach downgraded Innovative Industrial Properties to Peer Perform from Outperform and removed the firm's price target on the shares. Wolfe says that recent share price outperformance places the stock near the midpoint of its sensitivity analysis, which the firm's prior price target was based upon, implying fair value given ongoing cannabis industry pressures. Overall, Wolfe finds the stock near its fair value given associated risks.
Piper Sandler
Alexander Goldfarb
Sell
Maintains
$55 → $45
2025-04-15
Reason
Piper Sandler
Alexander Goldfarb
Price Target
$55 → $45
2025-04-15
Maintains
Sell
Reason
Piper Sandler analyst Alexander Goldfarb lowered the firm's price target on Innovative Industrial Properties to $45 from $55 and keeps an Underweight rating on the shares. Ahead of Q1 2025 earnings, the firm is adjusting estimates for recent company announcements and assumption revisions. Piper says its Innovative Industrial Properties update reflects its best estimation for replacing the rents impacted by recent tenant credit issues.
Piper Sandler
Alexander Goldfarb
Sell
Maintains
$60 → $55
2025-03-31
Reason
Piper Sandler
Alexander Goldfarb
Price Target
$60 → $55
2025-03-31
Maintains
Sell
Reason
Piper Sandler analyst Alexander Goldfarb lowered the firm's price target on Innovative Industrial Properties to $55 from $60 and keeps an Underweight rating on the shares. The firm notes the company announced more tenant defaults post-close on Friday, which represents its effort to clear the deck of delinquencies as management's patience seems to now be gone. Overcapacity, illicit market, and cross state border sales remain issues, now exacerbated by the pending outsized industry debt maturities in 2026, which stems from 2021's ultra-low rates, Piper adds.
Compass Point
Merrill Ross
Hold
to
Strong Sell
Downgrades
$60 → $50
2025-03-31
Reason
Compass Point
Merrill Ross
Price Target
$60 → $50
2025-03-31
Downgrades
Hold
to
Strong Sell
Reason
Compass Point downgraded Innovative Industrial Properties to Sell from Neutral with a price target of $50, down from $61. The company reported in a regulatory filing that it declared certain tenants in default and declared a default on a mortgage loan to Medical Investor Holdings, the analyst tells investors in a research note. The firm says that unless the four tenants cure the defaults, Innovative's Q2 earnings will be impacted, but not by more than 2%. Compass thinks these tenants are not likely to cure their default, and that Innovative will resort to taking control of the properties with the intent of re-leasing them. It believes the process will be protracted and that regaining possession of the properties will be expensive.
Compass Point
Merrill Ross
Hold
Maintains
$78 → $60
2025-03-18
Reason
Compass Point
Merrill Ross
Price Target
$78 → $60
2025-03-18
Maintains
Hold
Reason
Citizens Capital Markets
Aaron Hecht
Hold
Reiterates
n/a
2025-03-17
Reason
Citizens Capital Markets
Aaron Hecht
Price Target
n/a
2025-03-17
Reiterates
Hold
Reason
See All Ratings
Valuation Metrics
The current forward P/E ratio for Innovative Industrial Properties Inc (IIPR.N) is 14.06, compared to its 5-year average forward P/E of 24.22. For a more detailed relative valuation and DCF analysis to assess Innovative Industrial Properties Inc 's fair value, click here.
Forward PE
The forward P/E ratio is a valuation metric that divides a company's current stock price by its estimated future earnings per share over the next 12 months.

Fair
5Y Average PE
24.22
Current PE
14.06
Overvalued PE
34.87
Undervalued PE
13.56
Forward EV/EBITDA
The forward EV/EBITDA ratio is a valuation metric that divides a company's enterprise value (EV) by its estimated future earnings before interest, taxes, depreciation, and amortization (EBITDA) over the next 12 months.

Undervalued
5Y Average EV/EBITDA
15.84
Current EV/EBITDA
8.51
Overvalued EV/EBITDA
22.21
Undervalued EV/EBITDA
9.47
Forward PS
The forward P/S ratio is a valuation metric that divides a company's current stock price by its estimated future sales (or revenue) per share over the next 12 months.

Undervalued
5Y Average PS
12.70
Current PS
5.82
Overvalued PS
18.69
Undervalued PS
6.71
Financials
Annual
Quarterly
FY2025Q1
YoY :
-4.95%
71.72M
Total Revenue
FY2025Q1
YoY :
-10.15%
37.90M
Operating Profit
FY2025Q1
YoY :
-21.18%
31.08M
Net Income after Tax
FY2025Q1
YoY :
-24.26%
1.03
EPS - Diluted
FY2025Q1
YoY :
-32.18%
37.34M
Free Cash Flow
FY2025Q1
YoY :
-6.30%
64.07
Gross Profit Margin - %
FY2025Q1
YoY :
-17.07%
43.33
Net Margin - %
Trading Trends
Insider
Insiders are Neutral. There are no significant trading trends over the last month.
Sold
0-3
Months
0.0
USD
0
3-6
Months
536.1K
USD
1
6-9
Months
0.0
USD
0
0-12
Months
0.0
USD
0
Bought
0-3
0
0.0
USD
Months
3-6
0
0.0
USD
Months
6-9
0
0.0
USD
Months
0-12
0
0.0
USD
Months
Hedge Fund
Hedge Funds are Neutral. There are no significant trading trends over the last quarter.
Sold
0-3
Months
0.0
Volume
0
3-6
Months
0.0
Volume
0
6-9
Months
0.0
Volume
0
0-12
Months
0.0
Volume
0
Bought
0-3
0
0.0
Volume
Months
3-6
0
0.0
Volume
Months
6-9
0
0.0
Volume
Months
0-12
0
0.0
Volume
Months
Congress Trading
Congress are Neutral. There are no significant trading trends over the last month.
Sold
0-3
Months
0.0
USD
0
3-6
Months
0.0
USD
0
6-9
Months
0.0
USD
0
0-12
Months
0.0
USD
0
Bought
0-3
0
0.0
USD
Months
3-6
0
0.0
USD
Months
6-9
0
0.0
USD
Months
0-12
0
0.0
USD
Months
Insider
Insiders are Neutral. There are no significant trading trends over the last month.
Sold
0-3
Months
0.0
USD
0
3-6
Months
536.1K
USD
1
6-9
Months
0.0
USD
0
0-12
Months
0.0
USD
0
Bought
0-3
0
0.0
USD
Months
3-6
0
0.0
USD
Months
6-9
0
0.0
USD
Months
0-12
0
0.0
USD
Months
IIPR News & Events
Events Timeline
2025-05-07 (ET)
2025-05-07
16:33:33
Innovative Industrial Properties reports Q1 AFFO $1.94, consensus $1.99

2025-03-31 (ET)
2025-03-31
12:00:14
Innovative Industrial Properties falls -13.1%

2025-03-31
10:01:09
Innovative Industrial Properties falls -16.3%

Sign Up For More Events
News
8.0
07-19NASDAQ.COMNotable Friday Option Activity: SRPT, LLY, IIPR
8.0
07-15NASDAQ.COMHow To YieldBoost IIPR From 13.7% To 30.3% Using Options
3.0
07-14NASDAQ.COMPeek Under The Hood: DFAR Has 12% Upside
Sign Up For More News
People Also Watch

FIHL
Fidelis Insurance Holdings Ltd
15.600
USD
+0.06%

TMDX
Transmedics Group Inc
108.120
USD
+1.25%

INSW
International Seaways Inc
40.270
USD
-1.13%

ROCK
Gibraltar Industries Inc
65.960
USD
+1.21%

WGS
GeneDx Holdings Corp
79.830
USD
-1.99%

ALGT
Allegiant Travel Co
50.630
USD
+0.56%

CENX
Century Aluminum Co
22.900
USD
+0.35%

VYX
NCR Voyix Corp
14.380
USD
+1.48%

IDYA
IDEAYA Biosciences Inc
24.500
USD
-1.33%

PSEC
Prospect Capital Corp
3.460
USD
0.00%
FAQ

What is Innovative Industrial Properties Inc (IIPR) stock price today?
The current price of IIPR is 53.69 USD — it has increased 0.07 % in the last trading day.

What is Innovative Industrial Properties Inc (IIPR)'s business?

What is the price predicton of IIPR Stock?

What is Innovative Industrial Properties Inc (IIPR)'s revenue for the last quarter?

What is Innovative Industrial Properties Inc (IIPR)'s earnings per share (EPS) for the last quarter?

What changes have occurred in the market's expectations for Innovative Industrial Properties Inc (IIPR)'s fundamentals?

How many employees does Innovative Industrial Properties Inc (IIPR). have?
