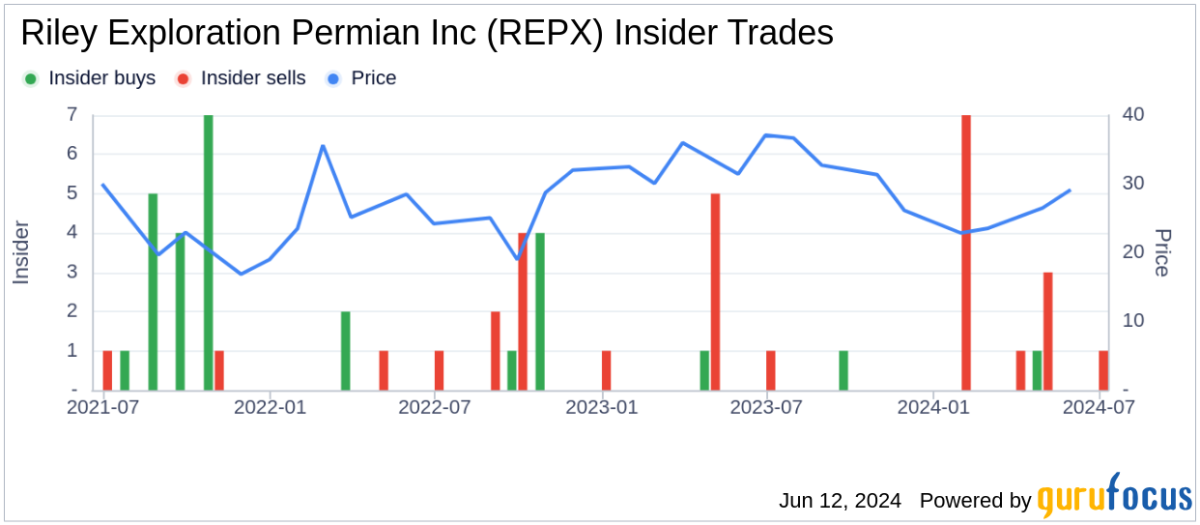
Intellectia LogoIntellectia
Product
Resources
Markets
News
Partner Program
Pricing
Log inTry for Free
Intellectia Logo
Log in
Intellectia Logo

Product

Features
Financial AI Agent
Stock Technical Analysis
Stock Monitor
Hedge Fund Tracker
AI Screener
Trading Strategies
AI Stock Picker
Swing Trading
Quant AI
Stock Chart Patterns
Daytrading Center
AI Earnings Prediction
Whales Auto Tracker
Backtesting Playground

Resources

Learn
Blog
Earnings
Tutorial
Help Center
Company
About Us
Contact
Press
Reward Program
Partner Program
Tools
Dividend Calculator
Dividend Yield Calculator
Options Profit Calculator
Compare
TradingView
SeekingAlpha

Markets

Trending Stocks
Hot Crypto
Trending News
All Stocks

News

Trading News
Overview
Top News
Daily Market Brief
Earnings
Latest
Newswire
Stock News
Crypto News
Monitor News
Partner ProgramPricing
Start for Free
  1. Home
  2. >
  3. Stock
  4. >
  5. CHRD
stocks logo

CHRD

-
collectAdd to Watchlistadvanced chartAdvanced Chart
$
0.000
0(0.000%)1D
collectadvanced chart
    Overview
    Forecast
    Valuation
    Earnings
High
--
Open
--
VWAP
--
Vol
--
Mkt Cap
--
Low
--
Amount
--
EV/EBITDA(TTM)
--
Total Shares
--
EV
--
EV/OCF(TTM)
--
P/S(TTM)
--
Financial AI Agent
Financial AI Agent

Market Estimates

Earnings Estimates
Earnings Estimates
Revenue
YoY Chg
EPS
YoYChg
FY2025Q4
FY2026Q1
FY2026Q2
1.02B
-30.01%
1.500
-57.01%
1.01B
-16.63%
1.699
-57.94%
1.04B
-12.1%
1.533
-14.37%
Estimates Revision
The market is revising Upward the revenue expectations for Chord Energy Corporation (CHRD) for FY2025, with the revenue forecasts being adjusted by 2.59% over the past three months. During the same period, the stock price has changed by -6.51%.
Revenue Estimates for FY2025
Revise Upward
up Image
+2.59%
In Past 3 Month
EPS Estimates for FY2025
Revise Upward
up Image
+8.41%
In Past 3 Month
Stock Price
Go Down
down Image
-6.51%
In Past 3 Month
Wall Street analysts forecast CHRD stock price to rise over the next 12 months. According to Wall Street analysts, the average 1-year price target for CHRD is 129.36 USD with a low forecast of 104.00 USD and a high forecast of 172.00 USD. However, analyst price targets are subjective and often lag stock prices, so investors should focus on the objective reasons behind analyst rating changes, which better reflect the company's fundamentals.
15 Analyst Rating
Wall Street analysts forecast CHRD stock price to rise over the next 12 months. According to Wall Street analysts, the average 1-year price target for CHRD is 129.36 USD with a low forecast of 104.00 USD and a high forecast of 172.00 USD. However, analyst price targets are subjective and often lag stock prices, so investors should focus on the objective reasons behind analyst rating changes, which better reflect the company's fundamentals.
11 Buy
4 Hold
0 Sell
Moderate Buy
Current: 96.690
sliders
Low
104.00
Averages
129.36
High
172.00
Current: 96.690
sliders
Low
104.00
Averages
129.36
High
172.00
William Blair
Outperform
initiated
2025-11-21
Reason
William Blair
Price Target
2025-11-21
initiated
Outperform
Reason
William Blair initiated coverage of Chord Energy with an Outperform rating.
William Blair
William Blair
Outperform
initiated
$129
2025-11-21
Reason
William Blair
William Blair
Price Target
$129
2025-11-21
initiated
Outperform
Reason
William Blair initiated coverage of Chord Energy with an Outperform rating and no price target. With the stock's underperformance relative to peers, investors are missing Chord's "low-well breakeven, solid free cash flow, and pristine balance sheet," the analyst tells investors in a research note. The firm believes the company will acquire a large-scale Bakken asset. Chord's "capital discipline ensures down-cycle stability," Blair contends. It thinks the stock's weighted fair value is $129 per share, or 42% upside from current levels.
Piper Sandler
Overweight
maintain
$167 -> $165
2025-11-18
Reason
Piper Sandler
Price Target
$167 -> $165
2025-11-18
maintain
Overweight
Reason
Piper Sandler lowered the firm's price target on Chord Energy to $165 from $167 and keeps an Overweight rating on the shares. The firm updated exploration and production models post the Q3 reports. The sector posted strong results with operations, efficiencies and costs trending in the right direction, but the oil macro environment "still doesn't feel great," the analyst tells investors in a research note. Piper thinks the rally in gas equities "has run a bit too far."
Wells Fargo
Overweight
maintain
$108 -> $113
2025-11-14
Reason
Wells Fargo
Price Target
$108 -> $113
2025-11-14
maintain
Overweight
Reason
Wells Fargo raised the firm's price target on Chord Energy to $113 from $108 and keeps an Overweight rating on the shares. The firm says that while shares lagged post-print due to absence of Marcellus sale and limited 2026 capex relief, Chord Energy's faster long-lateral ramp is positive surprise that strengthens 2027 capital efficiency upside and supports its constructive stance.
UBS
Josh Silverstein
Buy
downgrade
$130 -> $123
2025-11-12
Reason
UBS
Josh Silverstein
Price Target
$130 -> $123
2025-11-12
downgrade
Buy
Reason
UBS analyst Josh Silverstein lowered the firm's price target on Chord Energy to $123 from $130 and keeps a Buy rating on the shares. The firm updated its model following Chord's Q3 earnings report.
Morgan Stanley
Equal Weight
downgrade
$131 -> $128
2025-10-14
Reason
Morgan Stanley
Price Target
$131 -> $128
2025-10-14
downgrade
Equal Weight
Reason
Morgan Stanley lowered the firm's price target on Chord Energy to $128 from $131 and keeps an Equal Weight rating on the shares. The firm is updating its price targets for Energy in the North America stock under its coverage, the analyst tells investors. The firm expects "clean" Q3 operational updates, but cash flow will likely be generally below consensus due to weaker gas and NGL realizations.
See All Ratings

Valuation Metrics

The current forward P/E ratio for Chord Energy Corp (CHRD.O) is 14.81, compared to its 5-year average forward P/E of 7.44. For a more detailed relative valuation and DCF analysis to assess Chord Energy Corp 's fair value, click here.
  • Forward PE
  • Forward EV/EBITDA
  • Forward PS

Forward PE

The forward P/E ratio is a valuation metric that divides a company's current stock price by its estimated future earnings per share over the next 12 months.
StronglyUndervaluedUndervaluedFairOvervaluedStronglyOvervalueddotted line Image
Strongly Overvalued
5Y Average PE
7.44
Current PE
14.81
Overvalued PE
10.54
Undervalued PE
4.33

Forward EV/EBITDA

The forward EV/EBITDA ratio is a valuation metric that divides a company's enterprise value (EV) by its estimated future earnings before interest, taxes, depreciation, and amortization (EBITDA) over the next 12 months.
StronglyUndervaluedUndervaluedFairOvervaluedStronglyOvervalueddotted line Image
N/A
5Y Average EV/EBITDA
3.03
Current EV/EBITDA
0.00
Overvalued EV/EBITDA
3.65
Undervalued EV/EBITDA
2.42

Forward PS

The forward P/S ratio is a valuation metric that divides a company's current stock price by its estimated future sales (or revenue) per share over the next 12 months.
StronglyUndervaluedUndervaluedFairOvervaluedStronglyOvervalueddotted line Image
N/A
5Y Average PS
1.52
Current PS
0.00
Overvalued PS
1.89
Undervalued PS
1.16
AI Stock Picker
AI Stock Picker

Financials

Annual
Quarterly
N/A
Total Revenue
N/A
Operating Profit
N/A
Net Income after Tax
N/A
EPS - Diluted
N/A
Free Cash Flow
N/A
Gross Profit Margin - %
N/A
Net Margin - %

Trading Trends

  • Insider
  • Hedge Fund
  • Congress Trading
Insider
Insiders are Neutral. There are no significant trading trends over the last month.
Sold
Bought
Hedge Fund
Hedge Funds are Neutral. There are no significant trading trends over the last quarter.
Sold
Bought
Congress Trading
Congress are Neutral. There are no significant trading trends over the last month.
Sold
Bought
Insider
Insiders are Neutral. There are no significant trading trends over the last month.
Sold
Bought
Intellectia AI SwingMax

CHRD News & Events

Events Timeline

(ET)
2025-11-04
16:40:36
Chord Energy announces Q3 EPS of $2.26, slightly below consensus of $2.29
select
2025-09-15 (ET)
2025-09-15
17:04:09
Chord Energy to purchase Williston Basin assets for $550 million in cash
select
Sign Up For More Events

News

[object Object]
Preview
5.0
12-03NASDAQ.COM
Directors' Major Purchases: Holroyd Invests $106.9K in CHRD
  • Insider Buying Significance: Directors making significant stock purchases, like Samantha Holroyd's $106.9K buy at Chord Energy Corp, often indicate their confidence in the company's future performance.

  • Current Stock Performance: Chord Energy Corp shares are currently trading at $93.10, down 1.5%, with a 52-week range between $79.83 and $129.32.

  • Dividend Information: The company pays an annualized dividend of $5.2 per share, with a recent yield of approximately 5.5%, indicating a stable dividend history.

  • Market Insights: The article emphasizes the importance of monitoring insider buying trends as a potential indicator of stock value and company health.

[object Object]
Preview
8.0
11-25NASDAQ.COM
Boost Chord Energy Yield to 20.5% Through Options
  • Dividend Predictability: Dividend amounts for companies like Chord Energy Corp are influenced by profitability and may not be predictable, making historical data important for assessing future yields.

  • Stock Performance Analysis: The trading history and volatility of Chord Energy Corp can aid in evaluating the potential risks and rewards of options strategies, such as selling covered calls.

  • Volatility Measurement: Chord Energy Corp's trailing twelve-month volatility is calculated at 42%, which is a key factor in options trading decisions.

  • Author's Perspective: The opinions expressed in the article are those of the author and do not necessarily represent the views of Nasdaq, Inc.

[object Object]
Preview
9.5
11-13NASDAQ.COM
Chord Energy Shares Experience Slight Increase Following Q3 Earnings Surprise
  • Third-Quarter Performance: Chord Energy Corporation reported third-quarter adjusted earnings of $2.35 per share, exceeding estimates, but down from $3.40 a year ago. Total revenues of $1,312.1 million also surpassed expectations but decreased from $1,450.5 million in the previous year.

  • Production and Costs: The company’s total production was 280.9 MBoE/D, nearly unchanged from the previous year, with oil production slightly down. Operating expenses decreased to $1,140.9 million, although lease operating costs increased.

  • Future Production Guidance: Chord Energy projects production for 2025 to be between 275.6 MBoE/D and 278.1 MBoE/D, with fourth-quarter oil production expected to range from 149 MBbl/D to 153 MBbl/D.

  • Market Context: The article highlights the ongoing earnings season for energy companies, noting that major players like Exxon Mobil and Chevron have also reported better-than-expected earnings.

Sign Up For More News

People Also Watch

FAQ

arrow icon

What is Chord Energy Corp (CHRD) stock price today?

The current price of CHRD is 96.69 USD — it has increased 0.86 % in the last trading day.

arrow icon

What is Chord Energy Corp (CHRD)'s business?

Chord Energy Corporation is an independent exploration and production company, which is engaged in the acquisition, exploration, development and production of crude oil, natural gas liquids (NGL) and natural gas primarily in the Williston Basin. The Company’s operations are focused on the North Dakota and Montana areas of the Williston Basin, targeting the Middle Bakken and Three Forks formations, which are present across a substantial portion of its acreage. The Company has an average daily production of approximately 232,737 net barrels of oil equivalent per day (Boepd). It has approximately 9,011 (4,174.2 net) total gross productive wells, of which 4,824 gross (3,752.2 net) productive wells were operated by the Company. The Company sells its crude oil, NGL and natural gas production to refiners, marketers and other purchasers that have access to nearby pipeline and rail facilities.

arrow icon

What is the price predicton of CHRD Stock?

Wall Street analysts forecast CHRD stock price to rise over the next 12 months. According to Wall Street analysts, the average 1-year price target for CHRD is 129.36 USD with a low forecast of 104.00 USD and a high forecast of 172.00 USD. However, analyst price targets are subjective and often lag stock prices, so investors should focus on the objective reasons behind analyst rating changes, which better reflect the company's fundamentals.

arrow icon

What is Chord Energy Corp (CHRD)'s revenue for the last quarter?

Chord Energy Corp revenue for the last quarter amounts to 1.31B USD, decreased -9.54 % YoY.

arrow icon

What is Chord Energy Corp (CHRD)'s earnings per share (EPS) for the last quarter?

Chord Energy Corp. EPS for the last quarter amounts to 2.26 USD, decreased -37.05 % YoY.

arrow icon

What changes have occurred in the market's expectations for Chord Energy Corp (CHRD)'s fundamentals?

The market is revising Upward the revenue expectations for Chord Energy Corporation (CHRD) for FY2025, with the revenue forecasts being adjusted by 2.59% over the past three months. During the same period, the stock price has changed by -6.51%.
arrow icon

How many employees does Chord Energy Corp (CHRD). have?

Chord Energy Corp (CHRD) has 762 emplpoyees as of December 05 2025.

arrow icon

What is Chord Energy Corp (CHRD) market cap?

Today CHRD has the market capitalization of 5.50B USD.

Intellectia LogoIntellectiaIntellectia LogoIntellectia

Redefine Your Investment Decisions

TwitterTwitterYoutubeYoutubeQuoraQuoraDiscordDiscordLinkedinLinkedinTelegramTelegram
AppStoreGooglePlay

Copyright © 2025 Intellectia.AI. All Rights Reserved.

pci certified logo
Company
HomeContactAbout UsNews Release
Compare
TradingViewSeeking Alpha
Features
Financial AI AgentStock Technical AnalysisStock MonitorHedge Fund TrackerAI ScreenerDaytrading Center
Strategies
AI Stock PickerSwing TradingStock Chart PatternsEarnings TradingDaytrading CenterAI Earnings PredictionQuant AIWhales Auto TrackerBacktesting Playground
Free Tools
Dividend CalculatorDividend Yield CalculatorOptions Profit Calculator
Resource
BlogTutorialEarningsTrending StocksCrypto MarketPartner ProgramTerms of UsePrivacy PolicySecuritySitemap
Start for Free