Intellectia LogoIntellectia
Product
Resources
Markets
News
Partner Program
Pricing
Log inTry for Free
Intellectia Logo
Log in
Intellectia Logo

Product

Features
Financial AI Agent
Stock Technical Analysis
Stock Monitor
Hedge Fund Tracker
AI Screener
Trading Strategies
AI Stock Picker
Swing Trading
Quant AI
Stock Chart Patterns
Daytrading Center
AI Earnings Prediction
Whales Auto Tracker
Backtesting Playground

Resources

Learn
Blog
Earnings
Tutorial
Help Center
Company
About Us
Contact
Press
Reward Program
Partner Program
Tools
Dividend Calculator
Dividend Yield Calculator
Options Profit Calculator
Compare
TradingView
SeekingAlpha

Markets

Trending Stocks
Hot Crypto
Trending News
All Stocks

News

Trading News
Overview
Top News
Daily Market Brief
Earnings
Latest
Newswire
Stock News
Crypto News
Monitor News
Partner ProgramPricing
Start for Free
  1. Home
  2. >
  3. Stock
  4. >
  5. REPX
stocks logo

REPX

-
collectAdd to Watchlistadvanced chartAdvanced Chart
$
0.000
0(0.000%)1D
collectadvanced chart
    Overview
    Forecast
    Valuation
    Earnings
High
--
Open
--
VWAP
--
Vol
--
Mkt Cap
--
Low
--
Amount
--
EV/EBITDA(TTM)
--
Total Shares
--
EV
--
EV/OCF(TTM)
--
P/S(TTM)
--
AI Stock Picker
AI Stock Picker

Market Estimates

Earnings Estimates
Earnings Estimates
Revenue
YoY Chg
EPS
YoYChg
FY2025Q4
FY2026Q1
FY2026Q2
111.57M
+8.64%
0.820
-31.88%
112.85M
+10.14%
0.735
-54.63%
113.60M
+33.03%
0.690
-32.35%
Estimates Revision
The market is revising Downward the revenue expectations for Riley Exploration Permian, Inc. (REPX) for FY2025, with the revenue forecasts being adjusted by -1.45% over the past three months. During the same period, the stock price has changed by -2.29%.
Revenue Estimates for FY2025
Revise Downward
down Image
-1.45%
In Past 3 Month
EPS Estimates for FY2025
Revise Downward
down Image
-3.72%
In Past 3 Month
Stock Price
Go Down
down Image
-2.29%
In Past 3 Month
Wall Street analysts forecast REPX stock price to rise over the next 12 months. According to Wall Street analysts, the average 1-year price target for REPX is 36.00 USD with a low forecast of 36.00 USD and a high forecast of 36.00 USD. However, analyst price targets are subjective and often lag stock prices, so investors should focus on the objective reasons behind analyst rating changes, which better reflect the company's fundamentals.
1 Analyst Rating
Wall Street analysts forecast REPX stock price to rise over the next 12 months. According to Wall Street analysts, the average 1-year price target for REPX is 36.00 USD with a low forecast of 36.00 USD and a high forecast of 36.00 USD. However, analyst price targets are subjective and often lag stock prices, so investors should focus on the objective reasons behind analyst rating changes, which better reflect the company's fundamentals.
1 Buy
0 Hold
0 Sell
Moderate Buy
Current: 27.780
sliders
Low
36.00
Averages
36.00
High
36.00
Current: 27.780
sliders
Low
36.00
Averages
36.00
High
36.00
William Blair
analyst
Outperform
initiated
2025-11-21
Reason
William Blair
analyst
Price Target
2025-11-21
initiated
Outperform
Reason
William Blair initiated coverage of Riley Exploration with an Outperform rating. Riley's unique assets and efficient operations provide solid free cash flow even when oil prices are relatively weak, says the analyst, who sees further upside potential from the company's power joint venture and New Mexico gas midstream assets. The firm sees a strong balance sheet and stable activity resulting in "continued solid shareholder return," the analyst tells investors.
Truist Securities
Neal Dingmann
Strong Buy
Maintains
$45 → $47
2025-01-13
Reason
Truist Securities
Neal Dingmann
Price Target
$45 → $47
2025-01-13
Maintains
Strong Buy
Reason
Truist raised the firm's price target on Riley Exploration to $47 from $45 and keeps a Buy rating on the shares as part of a broader research note updating the firm's model with 2026 expectations. Truist sees sequentially higher estimated 2026 earnings and free cash flows based on minimally lower commodity prices, minimally higher production, flat costs, minimal asset degradation, and minimal to moderate operational efficiencies, adding that it sees commodity prices - oil and natural gas - remaining firmer this year than many investors currently expect.
See All Ratings

Valuation Metrics

The current forward P/E ratio for Riley Exploration Permian Inc (REPX.A) is 8.79, compared to its 5-year average forward P/E of 5.21. For a more detailed relative valuation and DCF analysis to assess Riley Exploration Permian Inc 's fair value, click here.
  • Forward PE
  • Forward EV/EBITDA
  • Forward PS

Forward PE

The forward P/E ratio is a valuation metric that divides a company's current stock price by its estimated future earnings per share over the next 12 months.
StronglyUndervaluedUndervaluedFairOvervaluedStronglyOvervalueddotted line Image
Overvalued
5Y Average PE
5.21
Current PE
8.79
Overvalued PE
7.08
Undervalued PE
3.35

Forward EV/EBITDA

The forward EV/EBITDA ratio is a valuation metric that divides a company's enterprise value (EV) by its estimated future earnings before interest, taxes, depreciation, and amortization (EBITDA) over the next 12 months.
StronglyUndervaluedUndervaluedFairOvervaluedStronglyOvervalueddotted line Image
N/A
5Y Average EV/EBITDA
3.36
Current EV/EBITDA
0.00
Overvalued EV/EBITDA
4.34
Undervalued EV/EBITDA
2.37

Forward PS

The forward P/S ratio is a valuation metric that divides a company's current stock price by its estimated future sales (or revenue) per share over the next 12 months.
StronglyUndervaluedUndervaluedFairOvervaluedStronglyOvervalueddotted line Image
N/A
5Y Average PS
1.75
Current PS
0.00
Overvalued PS
2.40
Undervalued PS
1.10
Intellectia AI SwingMax

Financials

Annual
Quarterly
N/A
Total Revenue
N/A
Operating Profit
N/A
Net Income after Tax
N/A
EPS - Diluted
N/A
Free Cash Flow
N/A
Gross Profit Margin - %
N/A
FCF Margin - %
N/A
Net Margin - %
N/A
ROIC

Trading Trends

  • Insider
  • Hedge Fund
  • Congress Trading
Insider
Insiders are Neutral. There are no significant trading trends over the last month.
Sold
Bought
Hedge Fund
Hedge Funds are Neutral. There are no significant trading trends over the last quarter.
Sold
Bought
Congress Trading
Congress are Neutral. There are no significant trading trends over the last month.
Sold
Bought
Insider
Insiders are Neutral. There are no significant trading trends over the last month.
Sold
Bought
Financial AI Agent
Financial AI Agent

REPX News & Events

Events Timeline

(ET)
2025-12-04
08:10:00
Riley Exploration Sells Dovetail Midstream for Approximately $111M
select
2025-11-05 (ET)
2025-11-05
16:38:28
Riley Exploration Increases Midpoint Full-Year Oil Production Forecast by 2%
select
2025-11-05
16:37:41
Riley Exploration announces Q3 adjusted EPS of 88 cents, falling short of consensus estimate of $1.03.
select
Sign Up For More Events

News

[object Object]
Preview
7.5
12-04PRnewswire
Riley Exploration Sells Dovetail Midstream for $111 Million
  • Transaction Overview: Riley Exploration has entered into a purchase agreement with Targa Northern Delaware LLC to sell its wholly-owned subsidiary Dovetail Midstream for approximately $111 million in cash, with the transaction closing simultaneously, aimed at optimizing the company's financial structure.
  • Asset Background: Dovetail's assets primarily consist of natural gas gathering infrastructure serving production in Eddy County, New Mexico, and this sale will enable the company to focus on the development of its upstream assets.
  • Financial Impact: Proceeds from the transaction will be used to reduce borrowings on the company's credit facility and to pay income taxes and transaction costs, which is expected to enhance the company's financial flexibility.
  • Future Outlook: The company has the right to earn up to an additional $60 million in cash payments over five years based on specific performance thresholds, which will further strengthen the company's cash flow and investment capacity.
[object Object]
Preview
6.0
11-21Benzinga
William Blair Begins Coverage of Riley Exploration Permian with Positive Outlook
  • Real-time Intelligence: Benzinga Pro offers the fastest news alerts for traders to stay updated on market movements.

  • Exclusive Content: Subscribers gain access to unique stories and insights generated by Benzinga reporters.

  • Community of Traders: Over 10,000 serious traders are part of the Benzinga Pro community, enhancing their trading strategies.

  • Market Winning Tools: The platform is designed to help traders win in the markets every day with accurate stock market intelligence.

[object Object]
Preview
8.0
10-07NASDAQ.COM
Daily Dividend Update: LXFR, REPX, DOC, NPB, BBDC
  • Riley Exploration Permian Dividend Announcement: The Board of Directors approved a cash dividend of $0.40 per share, payable on November 6, 2025, reflecting a 5% increase from the previous dividend of $0.38.

  • Healthpeak Properties Dividend Declaration: Healthpeak Properties declared a monthly cash dividend of $0.10167 per share for the fourth quarter of 2025, payable on October 30 to stockholders of record as of October 17.

  • Northpointe Bancshares Dividend Declaration: Northpointe Bancshares announced a quarterly cash dividend of $0.025 per common share, payable on November 3, 2025, to stockholders of record as of October 15.

  • Barings BDC Dividend Declaration: Barings BDC declared a quarterly cash dividend of $0.26 per share, payable on December 10, 2025, to shareholders of record as of December 3.

Sign Up For More News

People Also Watch

FAQ

arrow icon

What is Riley Exploration Permian Inc (REPX) stock price today?

The current price of REPX is 27.78 USD — it has increased 1.02 % in the last trading day.

arrow icon

What is Riley Exploration Permian Inc (REPX)'s business?

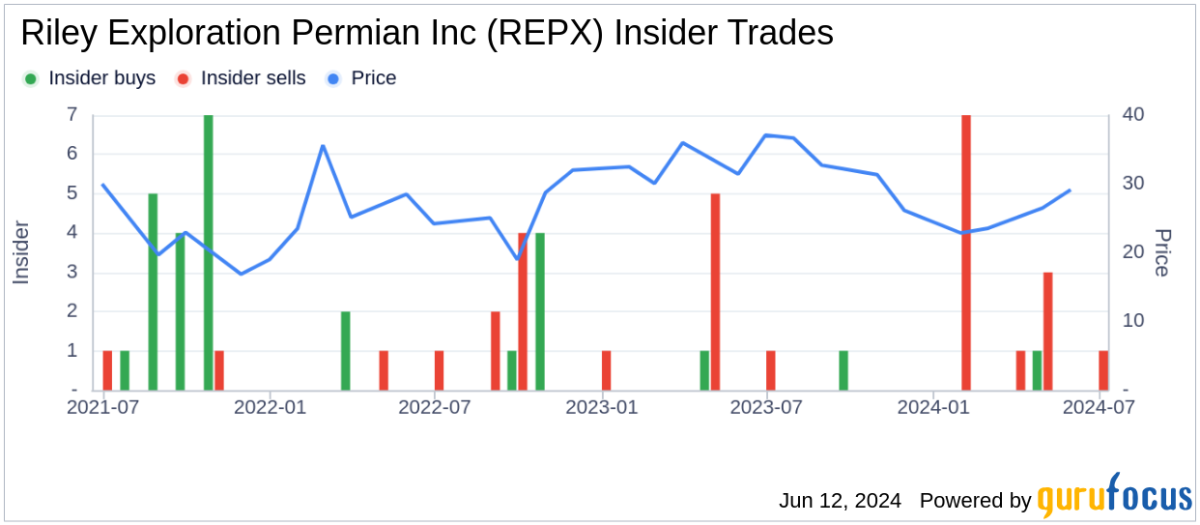
Riley Exploration Permian, Inc. is an independent oil and natural gas company focused on the acquisition, exploration, development and production of oil, natural gas and natural gas liquids. The Company is focused on horizontal drilling of conventional oil-saturated and liquids-rich formations in the Permian Basin that produce long-term cash flows. The Permian Basin is an oil and natural gas producing area located in West Texas and the adjoining area of Southeastern New Mexico covering an area approximately 250 miles wide and 300 miles long, and encompasses several sub-basins, including the Delaware Basin, Midland Basin, Central Basin Platform and Northwest Shelf. Its acreage is primarily located on large contiguous blocks in Yoakum County, Texas, which represents its Champions field and in Eddy County, New Mexico, which represents its Red Lake field. It holds approximately 105,270 net acres. Its land-based oil and natural gas facilities are typical of those found in the Permian Basin.

arrow icon

What is the price predicton of REPX Stock?

Wall Street analysts forecast REPX stock price to rise over the next 12 months. According to Wall Street analysts, the average 1-year price target for REPX is 36.00 USD with a low forecast of 36.00 USD and a high forecast of 36.00 USD. However, analyst price targets are subjective and often lag stock prices, so investors should focus on the objective reasons behind analyst rating changes, which better reflect the company's fundamentals.

arrow icon

What is Riley Exploration Permian Inc (REPX)'s revenue for the last quarter?

Riley Exploration Permian Inc revenue for the last quarter amounts to 106.85M USD, increased 4.41 % YoY.

arrow icon

What is Riley Exploration Permian Inc (REPX)'s earnings per share (EPS) for the last quarter?

Riley Exploration Permian Inc. EPS for the last quarter amounts to 0.77 USD, decreased -36.36 % YoY.

arrow icon

What changes have occurred in the market's expectations for Riley Exploration Permian Inc (REPX)'s fundamentals?

The market is revising Downward the revenue expectations for Riley Exploration Permian, Inc. (REPX) for FY2025, with the revenue forecasts being adjusted by -1.45% over the past three months. During the same period, the stock price has changed by -2.29%.
arrow icon

How many employees does Riley Exploration Permian Inc (REPX). have?

Riley Exploration Permian Inc (REPX) has 103 emplpoyees as of December 05 2025.

arrow icon

What is Riley Exploration Permian Inc (REPX) market cap?

Today REPX has the market capitalization of 610.30M USD.

Intellectia LogoIntellectiaIntellectia LogoIntellectia

Redefine Your Investment Decisions

TwitterTwitterYoutubeYoutubeQuoraQuoraDiscordDiscordLinkedinLinkedinTelegramTelegram
AppStoreGooglePlay

Copyright © 2025 Intellectia.AI. All Rights Reserved.

pci certified logo
Company
HomeContactAbout UsNews Release
Compare
TradingViewSeeking Alpha
Features
Financial AI AgentStock Technical AnalysisStock MonitorHedge Fund TrackerAI ScreenerDaytrading Center
Strategies
AI Stock PickerSwing TradingStock Chart PatternsEarnings TradingDaytrading CenterAI Earnings PredictionQuant AIWhales Auto TrackerBacktesting Playground
Free Tools
Dividend CalculatorDividend Yield CalculatorOptions Profit Calculator
Resource
BlogTutorialEarningsTrending StocksCrypto MarketPartner ProgramTerms of UsePrivacy PolicySecuritySitemap
Start for Free