Loading...

Intellectia LogoIntellectia
AI Trading Bot
Features
Markets
News
Resources
Pricing
Get Started
  1. Home
  2. Stock
  3. CRK
CRK logo

CRK Overview

-
$
0.000
0.000(0.000%)
At close
0.000(0.000%)Aft-market
ET
$
0.000
0.000(0.000%)
At close
0.000(0.000%)Aft-market
ET
OverviewStock Price PredictionTechnicalValuationFinancialsEarningsShould I BuyNews & Events
an image of Intellectia Logoan image of Intellectia

Most Trusted AI Platform for Winning Trades

TwitterYoutubeQuoraDiscordLinkedinTelegram

Copyright © 2026 Intellectia.AI. All Rights Reserved.

Company

  • Home
  • Contact
  • About Us
  • Press
  • Privacy
  • Terms of Service
  • Service Terms of Use

Resources

  • Blog
  • Tutorial
  • Help Center
  • Affiliate Program

Markets

  • Market Analysis
  • Crypto
  • Featured Screeners
  • AI Earnings Calendar
  • Market Movers
  • Stock Monitor
  • Economic Calendar
  • All US Stocks
  • All Cryptos

Tools

  • Dividend Calculator
  • Dividend Yield Calculator
  • Options Profit Calculator

Features

  • QuantAI Alpha Pick
  • SwingMax Portfolio
  • Swing Trading
  • AI Stock Picker
  • Whales Auto Tracker
  • Daytrading Center
  • Patterns Detection
  • AI Screener
  • Financial AI Agent
  • Backtesting Playground
  • AI Earnings Prediction
  • Stock Monitor
  • Technical Analysis

News

  • Overview
  • Top News
  • Daily Market Brief
  • Earnings Analysis
  • Newswire
  • Stock News
  • Crypto News
  • Institution News
  • Congress News
  • Monitor News

Compare

  • TradingView
  • SeekingAlpha
Intellectia

Loading chart...

High
23.310
Open
23.150
VWAP
22.32
Vol
2.29M
Mkt Cap
6.43B
Low
21.770
Amount
51.06M
EV/EBITDA(TTM)
9.31
Total Shares
294.02M
EV
9.53B
EV/OCF(TTM)
10.60
P/S(TTM)
3.33
Comstock Resources, Inc. is an independent energy company. The Company is engaged in the acquisition, exploration, development and production of oil and natural gas in the United States. The Company operates through the exploration and production of the North American natural gas and oil segment. Its primarily operates in the Haynesville shale, a natural gas basin located in North Louisiana and East Texas, with economic and geographical proximity to the Gulf Coast natural gas markets. The Company is focused on the development of drilling opportunities in the Haynesville and Bossier shales and exploration activities in the Western Haynesville play. It has over 1,099,090 acres (819,489 net) prospective for the Haynesville and Bossier shale plays, located in North Louisiana and East Texas, including its extension of the plays in its Western Haynesville area. The Company owns interests in over 2,427 producing natural gas and oil wells (1,542.6 net) and it operates 1,747 of these wells.
Show More

Events Timeline

(ET)
2026-03-23
08:10:00
Comstock Resources Partners with NextEra to Build $16B Natural Gas Power Hub
select
2026-02-11 (ET)
2026-02-11
16:30:00
Comstock Reports Q4 Revenue of $789.81M
select

News

Yahoo Finance
2.0
03-27Yahoo Finance
Middle East Tensions Drive Energy Stocks Higher
  • Energy Stock Rally: Energy stocks surged in the afternoon session due to escalating geopolitical tensions in the Middle East, with Borr Drilling's shares rising 3.6%, indicating increased investor interest in energy companies amid supply concerns.
  • Oil Prices Climb: Oil prices continued to rise even as President Trump extended the deadline for Iran to reopen the Strait of Hormuz by ten days, reflecting market anxiety over global oil supply risks and enhancing the outlook for oil and gas producers.
  • Clean Energy Fuels Volatility: Clean Energy Fuels saw an 8.1% increase in its stock price, despite experiencing 40 moves greater than 5% in the past year, suggesting that while the market reacted strongly to the news, it did not fundamentally alter perceptions of the company's business.
  • Long-Term Investment Challenges: Although Clean Energy Fuels has gained 18.3% year-to-date, its current price of $2.56 per share remains 16.5% below its 52-week high of $3.06, indicating significant challenges for long-term investors who would see their $1,000 investment from five years ago reduced to just $199.92.
seekingalpha
4.5
02-18seekingalpha
Analysis of Small-Cap Energy Stocks by RSI
  • RSI Ranking Overview: REX American Resources Corporation (REX) leads the list with an RSI of 44, indicating relatively stable market performance, which may attract investor interest.
  • Following Companies: Diversified Energy Company (DEC), RPC, Inc. (RES), and Sabine Royalty Trust (SBR) each have an RSI of 47, suggesting a higher relative strength in the market, potentially facing short-term price fluctuations.
  • Mid-Ranking Companies: Sable Offshore Corp. (SOC), TETRA Technologies (TTI), and Riley Exploration Permian (REPX) rank in the middle with an RSI of 48, indicating stable performance in the market, suitable for risk-averse investors.
  • Significance of RSI: The RSI is a momentum oscillator that measures the speed and magnitude of price changes, with readings above 70 typically indicating overbought conditions, prompting investors to carefully assess the timing of investments in these small-cap energy stocks.
seekingalpha
4.5
02-18seekingalpha
Top Mid-Cap Energy Stocks by RSI in the U.S.
  • RSI Overview: Comstock Resources (CRK) leads the list with an RSI of 34, indicating an oversold condition that may present a buying opportunity for investors looking for value.
  • Sector Distribution: The top ten stocks span various energy sub-sectors, including oil and gas exploration and production, coal and consumable fuels, oil and gas refining, and drilling services, reflecting the diversity and potential investment opportunities within the energy market.
  • RSI Interpretation: With RSI values ranging from 34 to 51, these stocks are generally trading below overbought levels, potentially attracting value-seeking investors amid volatility in the oil and gas sector.
  • Market Trends: As U.S.-Iran talks progress, crude oil prices drift lower, which may impact the short-term performance of energy stocks, prompting investors to monitor market dynamics for strategic adjustments.
moomoo
6.0
02-13moomoo
COMSTOCK RESOURCES INC: UBS Lowers Price Target to $17 from $18
  • Stock Price Adjustment: Comstock Resources has reduced its target price from $18 to $17.
  • Market Impact: This adjustment reflects changes in market conditions and company performance.
seekingalpha
9.5
02-11seekingalpha
Comstock Resources Q4 Earnings Beat Expectations
  • Strong Earnings Performance: Comstock Resources reported a Q4 non-GAAP EPS of $0.16, beating expectations by $0.05, which reflects the company's robust profitability and enhances investor confidence.
  • Significant Revenue Growth: The company achieved revenues of $789.81 million in Q4, marking a 115.5% year-over-year increase, primarily driven by strong demand for natural gas and oil sales, indicating sustained market demand for energy products.
  • Robust Cash Flow: Operating cash flow stood at $222 million, or $0.75 per diluted share, demonstrating the company's effective cost control and operational efficiency, thereby providing financial support for future investments and expansion.
  • Adjusted EBITDAX Improvement: The adjusted EBITDAX for the quarter was $277 million, indicating ongoing improvements in profitability and cash flow management, which strengthens its position in the competitive energy market.
seekingalpha
9.5
02-11seekingalpha
Major Earnings Reports Expected After Bell on Wednesday
  • Earnings Preview: Major earnings reports are expected after the bell on Wednesday from companies such as Cisco Systems (CSCO), QuantumScape Corporation (QS), and AppLovin Corporation (APP), all of which hold significant positions in their respective markets.
  • Industry Impact: Cisco, as a giant in networking equipment, will influence investor sentiment across the tech sector, while QuantumScape's focus on electric vehicle batteries may affect related stock performances.
  • Market Reaction: Investors will closely monitor these earnings to assess company performance and future outlooks, especially given the current economic climate where expectations for profitability are high.
  • Additional Reports: In addition to the aforementioned companies, earnings from Albemarle (ALB) and STAG Industrial (STAG) will also be released on Wednesday, further enriching market information and aiding investor decision-making.
Wall Street analysts forecast CRK stock price to rise
9 Analyst Rating
Wall Street analysts forecast CRK stock price to rise
1 Buy
6 Hold
2 Sell
Hold
Current: 0.000
sliders
Low
8.00
Averages
22.25
High
29.00
Current: 0.000
sliders
Low
8.00
Averages
22.25
High
29.00
Citi
Neutral
maintain
$23 -> $24
AI Analysis
2026-03-31
New
Reason
Citi
Price Target
$23 -> $24
AI Analysis
2026-03-31
New
maintain
Neutral
Reason
Citi raised the firm's price target on Comstock Resources to $24 from $23 and keeps a Neutral rating on the shares. The firm updated small-cap exploration and production models to reflect higher oil and gas price forecasts. Citi believes oil weighted companies are showing "robust capital discipline and a strong focus on shareholder returns."
Mizuho
Nitin Kumar
Neutral
maintain
$29 -> $30
2026-03-17
Reason
Mizuho
Nitin Kumar
Price Target
$29 -> $30
2026-03-17
maintain
Neutral
Reason
Mizuho analyst Nitin Kumar raised the firm's price target on Comstock Resources to $30 from $29 and keeps a Neutral rating on the shares. The firm upped its 2026 oil price outlook by 14% to $73.25 with the Iran conflict entering its third week. It is too early to say whether the conflict raises the structural price of global oil, but the bias is likely higher, the analyst tells investors in a research note. Mizuho remains positive on the oil and gas sector. While saying natural gas fundamentals remain constructive, the firm lowered its fiscal 2026 price outlook by 6%.
Unlock Full Analyst Thesis, Get the complete breakdown of rating reason for CRK
Unlock Now

Valuation Metrics

The current forward P/E ratio for Comstock Resources Inc (CRK.N) is 27.98, compared to its 5-year average forward P/E of 17.48. For a more detailed relative valuation and DCF analysis to assess Comstock Resources Inc's fair value, Click here.

Forward PE

The forward P/E ratio is a valuation metric that divides a company's current stock price by its estimated future earnings per share over the next 12 months.
StronglyUndervaluedUndervaluedFairOvervaluedStronglyOvervalueddotted line Image
N/A
5Y Average PE
17.48
Current PE
27.98
Overvalued PE
38.40
Undervalued PE
-3.45

Forward EV/EBITDA

The forward EV/EBITDA ratio is a valuation metric that divides a company's enterprise value (EV) by its estimated future earnings before interest, taxes, depreciation, and amortization (EBITDA) over the next 12 months.
StronglyUndervaluedUndervaluedFairOvervaluedStronglyOvervalueddotted line Image
5Y Average EV/EBITDA
5.07
Current EV/EBITDA
7.79
Overvalued EV/EBITDA
6.75
Undervalued EV/EBITDA
3.38

Forward PS

The forward P/S ratio is a valuation metric that divides a company's current stock price by its estimated future sales (or revenue) per share over the next 12 months.
StronglyUndervaluedUndervaluedFairOvervaluedStronglyOvervalueddotted line Image
5Y Average PS
1.89
Current PS
3.16
Overvalued PS
2.70
Undervalued PS
1.08

Financials

AI Analysis
Annual
Quarterly

Related Community Screener

create a stock picker with 1000 to spend
Intellectia · 44 candidates
Market Cap: 1000.00M - 15.00BPrice: $10.00 - $40.00Rsi Category: moderateList Exchange: XNYS, XNAS, XASEMonth Price Change Pct: $10.00 - $35.00One Week Rise Prob: 0 - 100Monthly Average Dollar Volume: >= 1,000,000
Ticker
Name
Market Cap$
top bottom
BTU logo
BTU
Peabody Energy Corp
4.65B
PLSE logo
PLSE
Pulse Biosciences Inc
1.45B
PUMP logo
PUMP
ProPetro Holding Corp
1.81B
TEN logo
TEN
Tsakos Energy Navigation Ltd
1.19B
CRK logo
CRK
Comstock Resources Inc
6.27B
VECO logo
VECO
Veeco Instruments Inc
2.08B
I would like to buy and sell stocks today
Intellectia · 23 candidates
Market Cap: >= 2.00BPrice: $5.00 - $100.00Price Change Pct: $3.00 - $15.00Relative Vol: >= 1.50Monthly Average Dollar Volume: >= 1,000,000
Ticker
Name
Market Cap$
top bottom
VG logo
VG
Venture Global Inc
35.11B
IBRX logo
IBRX
Immunitybio Inc
9.07B
APA logo
APA
APA Corp (US)
13.44B
BCRX logo
BCRX
BioCryst Pharmaceuticals Inc
2.46B
CRGY logo
CRGY
Crescent Energy Co
4.02B
SM logo
SM
SM Energy Co
6.61B
Give me mid and small-cap companies
Intellectia · 130 candidates
Sector: Energy, Energy - Fossil Fuels, Renewable EnergyRegion: USMarket Cap Category: mid, smallList Exchange: XNYS, XNAS, XASE
Ticker
Name
Market Cap$
top bottom
RRC logo
RRC
Range Resources Corp
9.85B
NXE logo
NXE
Nexgen Energy Ltd
8.20B
HESM logo
HESM
Hess Midstream LP
8.07B
FRO logo
FRO
Frontline Plc
7.77B
MUSA logo
MUSA
Murphy USA Inc
7.75B
KNTK logo
KNTK
Kinetik Holdings Inc
7.42B
mid-cap stocks about to break bullish
Intellectia · 61 candidates
Market Cap: 2.00B - 10.00BRsi Category: moderateList Exchange: XNYS, XNAS, XASEMoving Average Relationship: PriceAboveMA20Week Price Change Pct: >= $5.00Support Resistance Relationship: PriceBreakResistance
Ticker
Name
Market Cap$
top bottom
PLUG logo
PLUG
Plug Power Inc
3.11B
INTA logo
INTA
Intapp Inc
2.10B
BWIN logo
BWIN
Baldwin Insurance Group Inc
3.18B
WIX logo
WIX
Wix.Com Ltd
4.60B
SM logo
SM
SM Energy Co
5.74B
RCUS logo
RCUS
Arcus Biosciences Inc
2.81B
give me day trades to buy today
Intellectia · 28 candidates
Price: $5.00 - $100.00Price Change Pct: >= $3.00Support Resistance Relationship: PriceBreakResistanceMonthly Average Dollar Volume: >= 1,000,000
Ticker
Name
Market Cap$
top bottom
BATL logo
BATL
Battalion Oil Corp
194.19M
VG logo
VG
Venture Global Inc
27.96B
RCAT logo
RCAT
Red Cat Holdings Inc
1.63B
PINS logo
PINS
Pinterest Inc
11.63B
ASTS logo
ASTS
AST SpaceMobile Inc
32.49B
VET logo
VET
Vermilion Energy Inc
1.74B
entonces que acciones?
Intellectia · 74 candidates
Market Cap: >= 3.00BRsi Category: moderateWeek Price Change Pct: $5.00 - $20.00Ema 20: >= -100Ema 60: >= -100Monthly Average Dollar Volume: >= 1,000,000
Ticker
Name
Market Cap$
top bottom
SSL logo
SSL
Sasol Ltd
4.76B
LMND logo
LMND
Lemonade Inc
6.97B
TEO logo
TEO
Telecom Argentina SA
5.50B
SBS logo
SBS
Companhia de Saneamento Basico do Estado de Sao Paulo - SABESP
18.55B
KEP logo
KEP
Korea Electric Power Corp
27.73B
PKX logo
PKX
Posco Holdings Inc
19.18B
crypto and stock
Intellectia · 66 candidates
Volume: >= 2,000,000Price Change Pct: >= $7.00Week Price Change Pct: >= $5.00
Ticker
Name
Market Cap$
top bottom
AMD logo
AMD
Advanced Micro Devices Inc
406.68B
INTC logo
INTC
Intel Corp
258.77B
WDC logo
WDC
Western Digital Corp
82.71B
SNDK logo
SNDK
Sandisk Corp
73.47B
BIDU logo
BIDU
Baidu Inc
55.79B
BNTX logo
BNTX
Biontech SE
29.61B
stock option recommendations for monday
Intellectia · 11 candidates
Ticker
Name
Market Cap$
top bottom
AVGO logo
AVGO
Broadcom Inc
1.56T
PLTR logo
PLTR
Palantir Technologies Inc
394.05B
NU logo
NU
Nu Holdings Ltd
83.54B
B logo
B
Barrick Mining Corp
82.80B
DELL logo
DELL
Dell Technologies Inc
75.06B
AA logo
AA
Alcoa Corp
16.54B
what can I invest to make fast cash
Intellectia · 102 candidates
Market Cap: 2.00B - 20.00BRsi Category: moderateRelative Vol: >= 1.20Beta: ModerateRisk, HighRiskWeek Price Change Pct: >= $3.00
Ticker
Name
Market Cap$
top bottom
GKOS logo
GKOS
Glaukos Corp
7.13B
BRBR logo
BRBR
Bellring Brands Inc
3.33B
PLAB logo
PLAB
Photronics Inc
2.14B
SMCI logo
SMCI
Super Micro Computer Inc
19.25B
MYRG logo
MYRG
MYR Group Inc
3.99B
GPOR logo
GPOR
Gulfport Energy Corp
3.78B

Whales Holding CRK

A
Aventail Capital Group, LP
Holding
CRK
+15.72%
3M Return
C
Cooper Creek Partners Management LLC
Holding
CRK
+12.01%
3M Return
B
Blue Star Exploration Company
Holding
CRK
-5.61%
3M Return
D
Dragoneer Investment Group, LLC
Holding
CRK
-23.08%
3M Return

Trading Trends

    Insider
    Hedge Fund
    Congress Trading

People Also Watch

Frequently Asked Questions

What is Comstock Resources Inc (CRK) stock price today?

The current price of CRK is 21.88 USD — it has decreased -6.62

What is Comstock Resources Inc (CRK)'s business?

Comstock Resources, Inc. is an independent energy company. The Company is engaged in the acquisition, exploration, development and production of oil and natural gas in the United States. The Company operates through the exploration and production of the North American natural gas and oil segment. Its primarily operates in the Haynesville shale, a natural gas basin located in North Louisiana and East Texas, with economic and geographical proximity to the Gulf Coast natural gas markets. The Company is focused on the development of drilling opportunities in the Haynesville and Bossier shales and exploration activities in the Western Haynesville play. It has over 1,099,090 acres (819,489 net) prospective for the Haynesville and Bossier shale plays, located in North Louisiana and East Texas, including its extension of the plays in its Western Haynesville area. The Company owns interests in over 2,427 producing natural gas and oil wells (1,542.6 net) and it operates 1,747 of these wells.

What is the price predicton of CRK Stock?

Wall Street analysts forecast CRK stock price to rise over the next 12 months. According to Wall Street analysts, the average 1-year price target for CRK is22.25 USD with a low forecast of 8.00 USD and a high forecast of 29.00 USD. However, analyst price targets are subjective and often lag stock prices, so investors should focus on the objective reasons behind analyst rating changes, which better reflect the company's fundamentals.

What is Comstock Resources Inc (CRK)'s revenue for the last quarter?

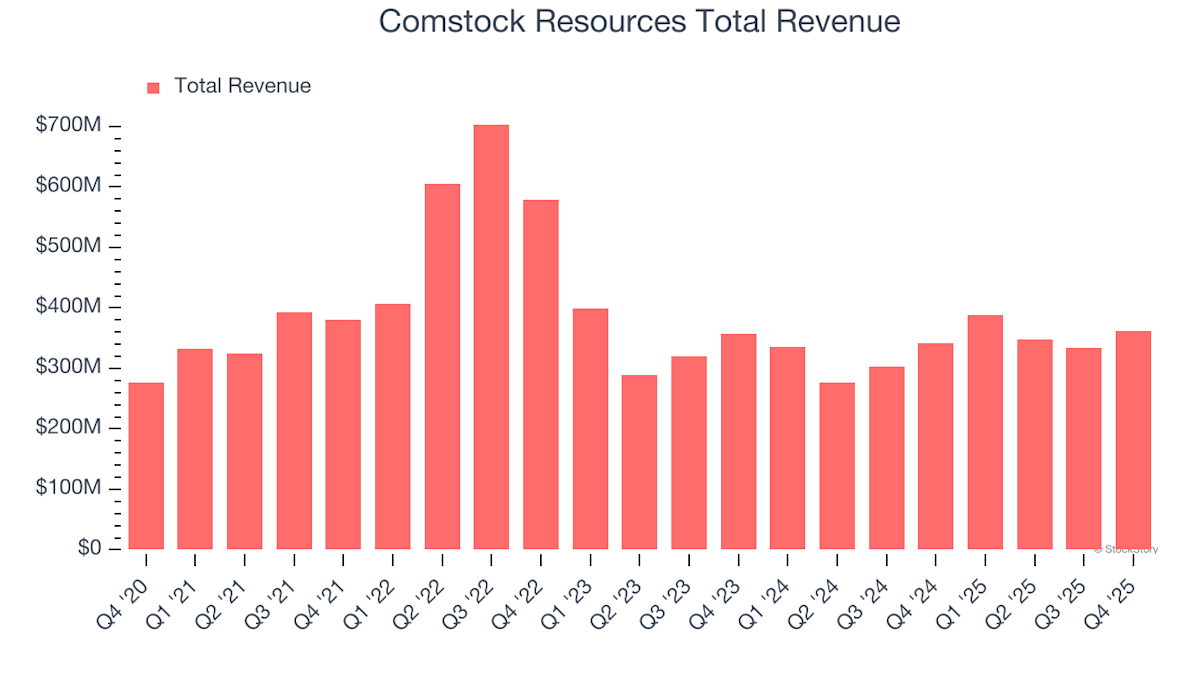
Comstock Resources Inc revenue for the last quarter amounts to 495.38M USD, increased 35.16

What is Comstock Resources Inc (CRK)'s earnings per share (EPS) for the last quarter?

Comstock Resources Inc. EPS for the last quarter amounts to 0.95 USD, decreased -575.00

How many employees does Comstock Resources Inc (CRK). have?

Comstock Resources Inc (CRK) has 252 emplpoyees as of March 31 2026.

What is Comstock Resources Inc (CRK) market cap?

Today CRK has the market capitalization of 6.43B USD.