ATNM Overview
-
$
0.000
0.000(0.000%)
At close0.000(0.000%)Aft-market
ET
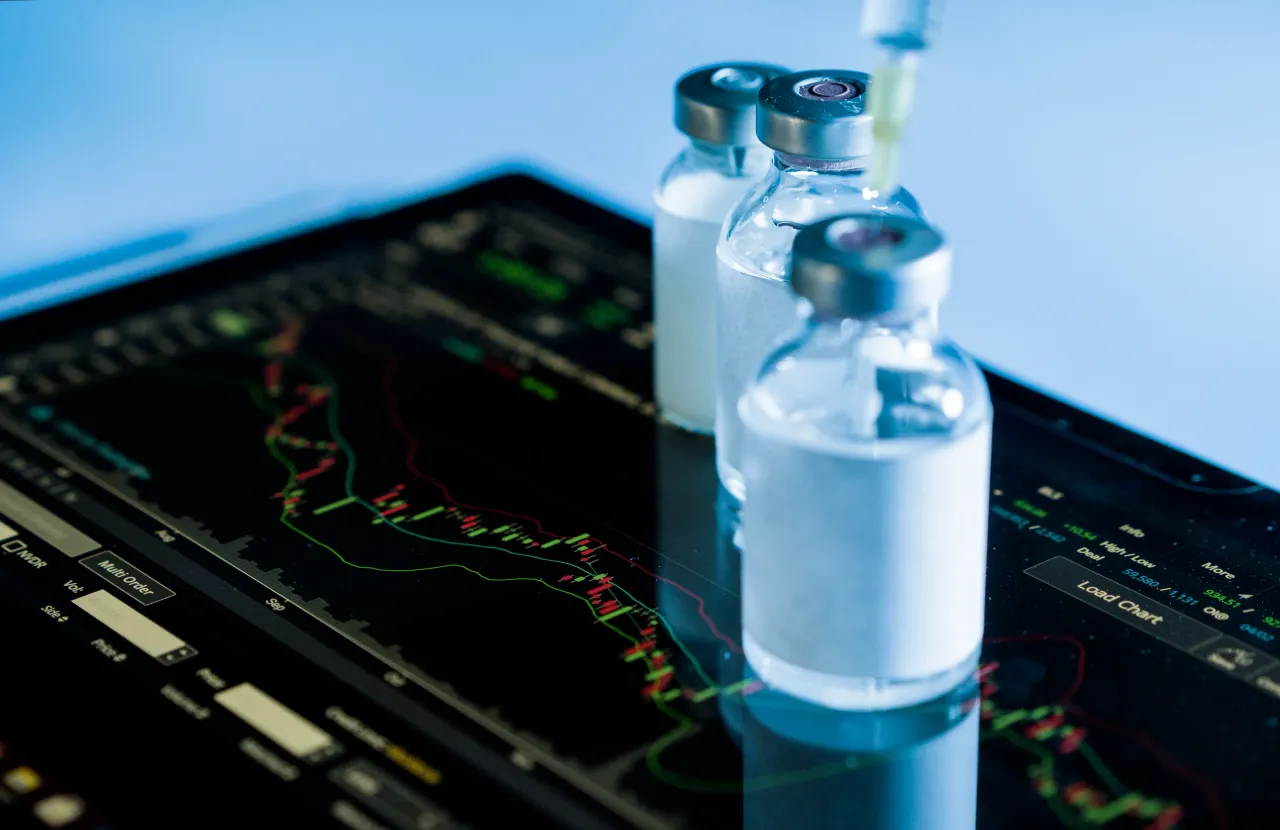
Loading chart...


The current price of ATNM is 1.05 USD — it has increased 9.26
Actinium Pharmaceuticals, Inc. is a clinical-stage biopharmaceutical company pioneering the development of targeted radiotherapies to address significant unmet medical needs in oncology. It operates a pipeline of both early and later stage development programs with two novel solid tumor product candidates, ATNM-400 and Actimab-A, with pan-tumor potential; Actimab-A, which is also being developed as a therapeutic backbone for acute myeloid leukemia and myelodysplastic syndrome in partnership with the National Cancer Institute (NCI), and two targeted conditioning agents, Iomab-B for bone marrow transplant and Iomab-ACT for cell & gene therapies. Its solid tumor asset, ATNM-400, targets a novel antigen distinct from PSMA, with demonstrated preclinical activity across metastatic castration-resistant prostate cancer (mCRPC), non-small cell lung cancer (NSCLC), and breast cancer. Its hematology franchise includes Actimab-A, Iomab-B and Iomab-ACT, which are CD45-targeting conditioning agents.
Wall Street analysts forecast ATNM stock price to rise over the next 12 months. According to Wall Street analysts, the average 1-year price target for ATNM is6.00 USD with a low forecast of 4.00 USD and a high forecast of 9.00 USD. However, analyst price targets are subjective and often lag stock prices, so investors should focus on the objective reasons behind analyst rating changes, which better reflect the company's fundamentals.
Actinium Pharmaceuticals Inc revenue for the last quarter amounts to 0.00 USD, decreased
Actinium Pharmaceuticals Inc. EPS for the last quarter amounts to -0.18 USD, decreased -64.71
Actinium Pharmaceuticals Inc (ATNM) has 25 emplpoyees as of July 08 2026.
Today ATNM has the market capitalization of 32.94M USD.