VMC Overview
-
$
0.000
0.000(0.000%)
At close0.000(0.000%)Aft-market
ET
Loading chart...


The current price of VMC is 288.73 USD — it has increased 0.75
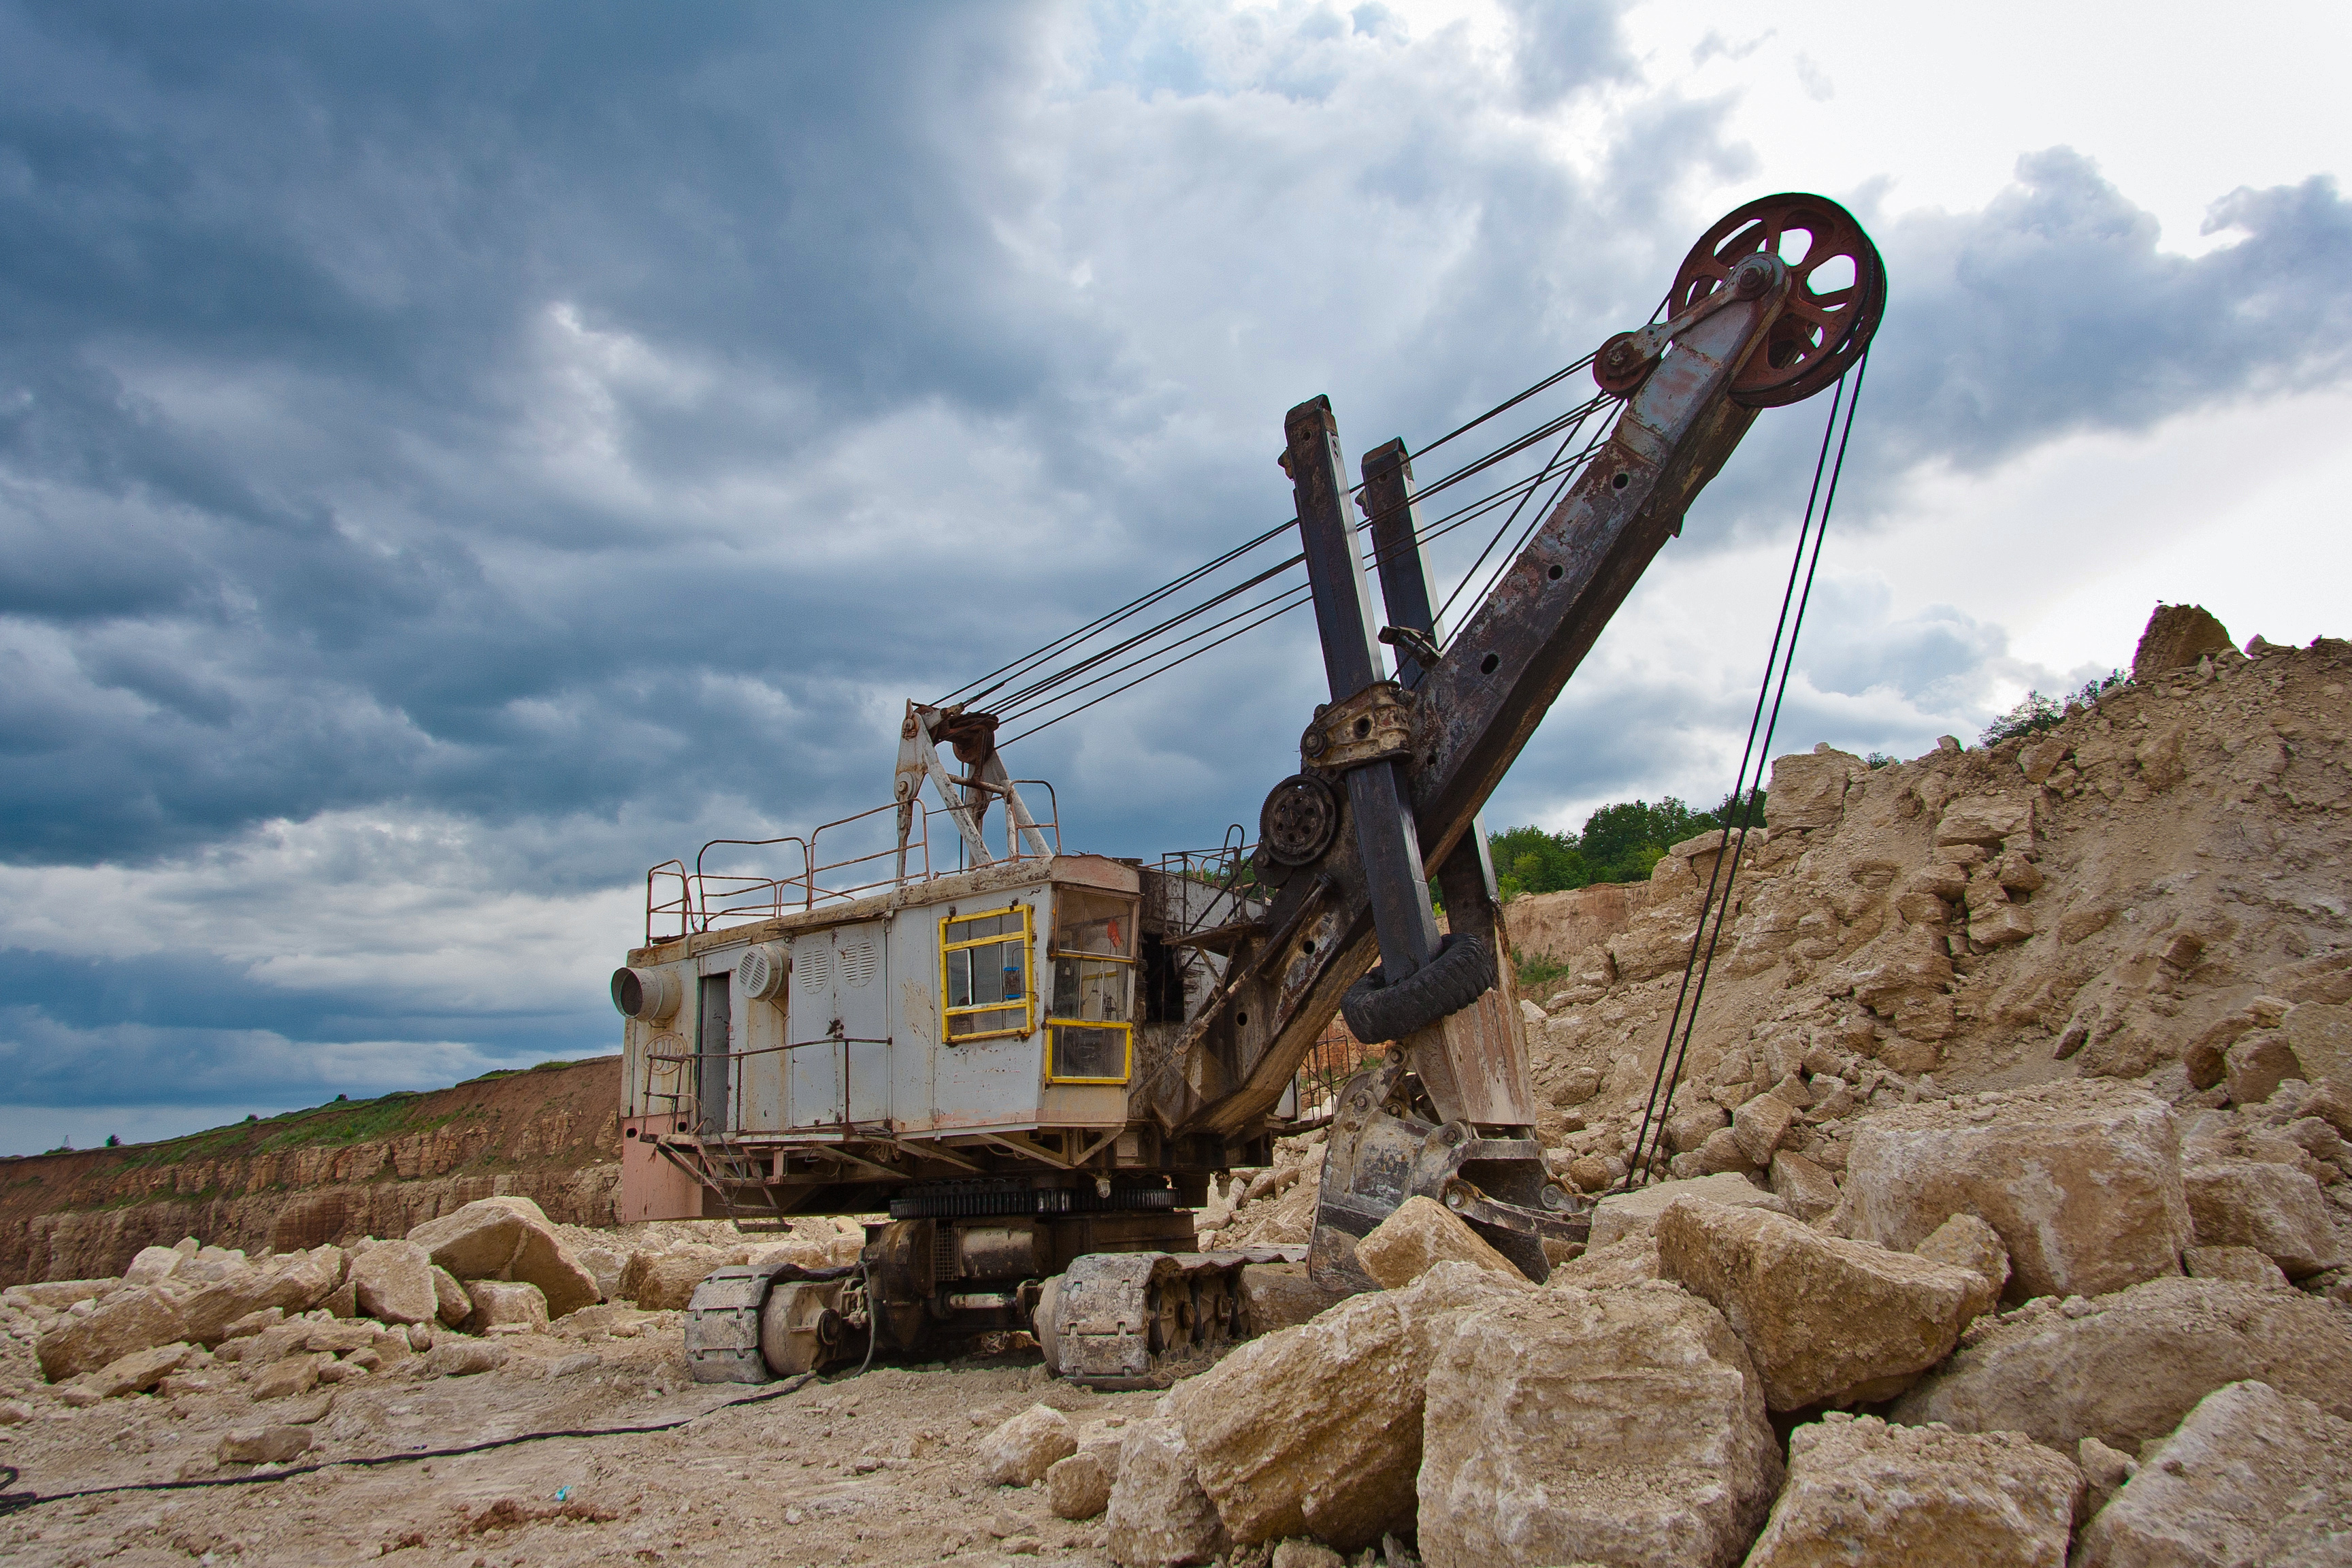
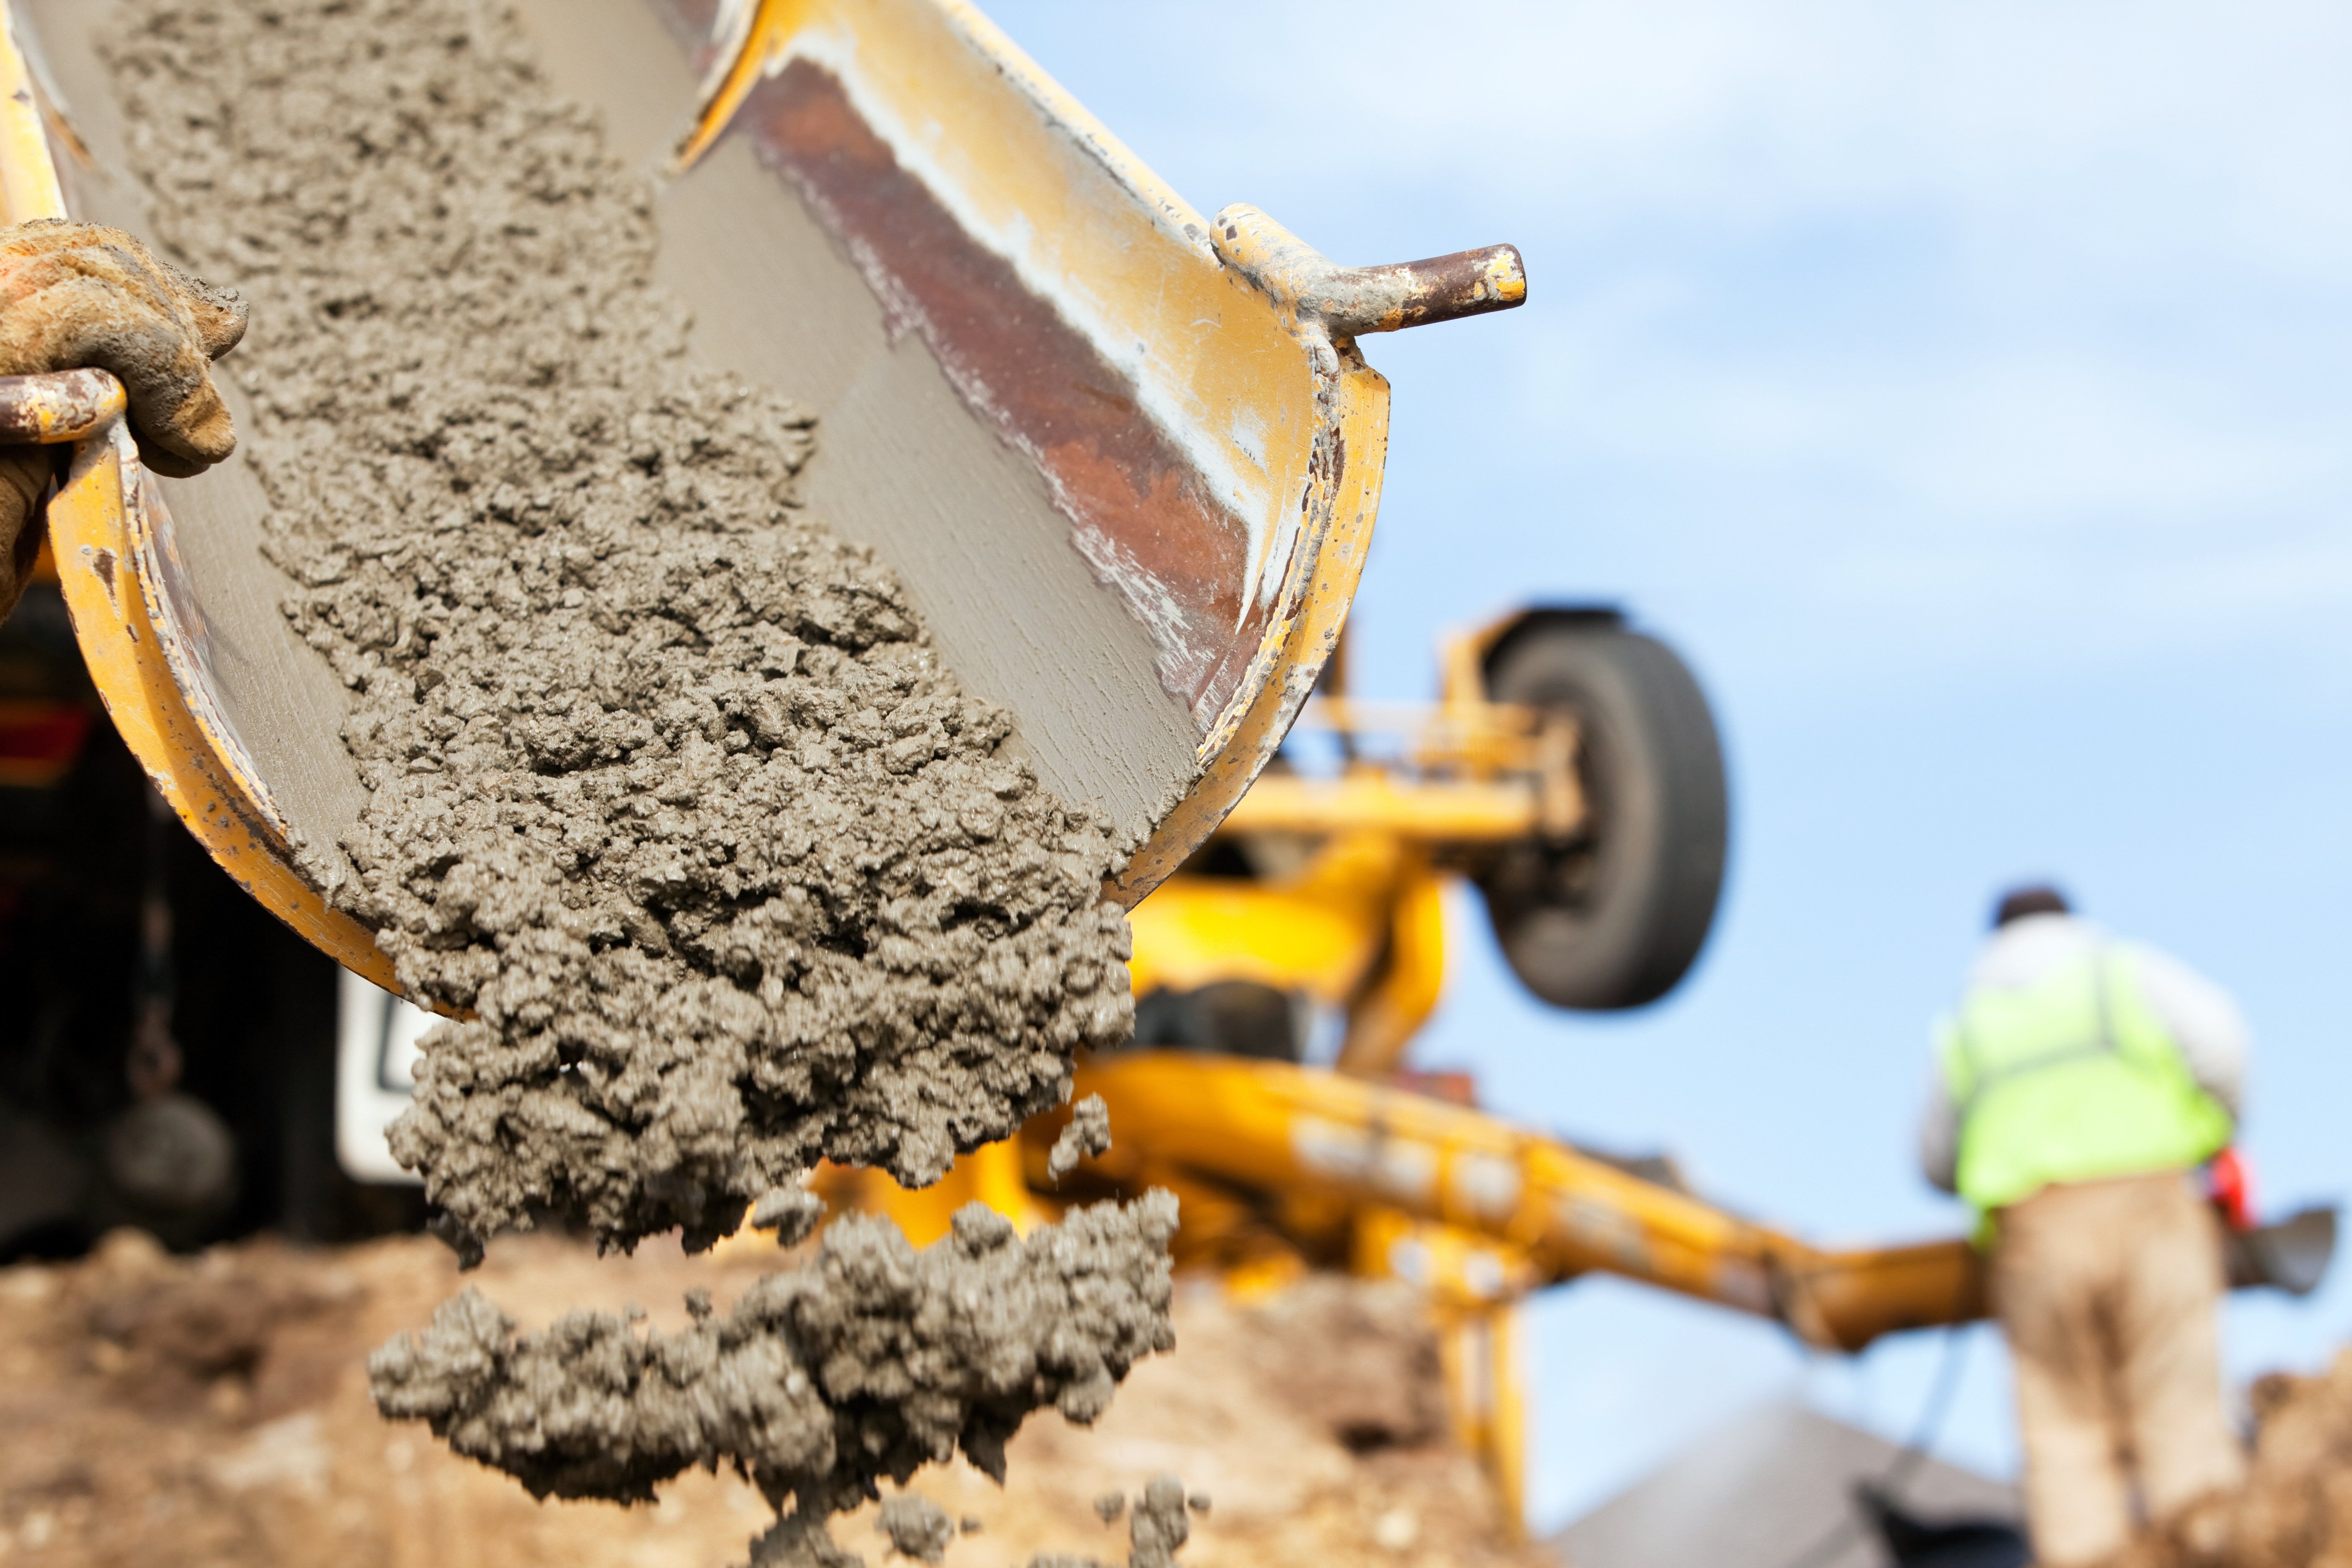
Vulcan Materials Company is a supplier of construction aggregates and producer of aggregates-intensive downstream products. The Company's segments include Aggregates, Asphalt and Concrete. The Aggregates segment produces and sells aggregates (crushed stone, sand and gravel, sand, and other aggregates) and related products and services. This segment also includes a production stage and leased calcium operation located in Brooksville, Florida. This limestone quarry produces a supplement for end-use products such as animal feed and plastics. The Asphalt segment produces and sells asphalt mix in Alabama, Arizona, California, New Mexico, Tennessee and Texas and provides asphalt construction paving services in Alabama and Tennessee. The Concrete segment produces and sells ready-mixed concrete in Maryland and Virginia. The Company's products are essential for building homes, offices, data centers, places of worship, schools, hospitals and factories and others.
Wall Street analysts forecast VMC stock price to rise over the next 12 months. According to Wall Street analysts, the average 1-year price target for VMC is334.13 USD with a low forecast of 316.00 USD and a high forecast of 370.00 USD. However, analyst price targets are subjective and often lag stock prices, so investors should focus on the objective reasons behind analyst rating changes, which better reflect the company's fundamentals.
Vulcan Materials Co revenue for the last quarter amounts to 1.76B USD, increased 7.42
Vulcan Materials Co. EPS for the last quarter amounts to 1.26 USD, increased 29.90
Vulcan Materials Co (VMC) has 11172 emplpoyees as of July 10 2026.
Today VMC has the market capitalization of 37.19B USD.